
High River Real Estate Market Update: May 2026

By John Seacrist
Realtor, Seacrist Real Estate | C21 Foothills
June 13, 2026
After several months of market normalization, High River saw stronger demand emerge in May. Sales increased, new listings declined, and inventory remained relatively tight compared to historical averages.
While Calgary and Okotoks continue adjusting to higher inventory levels and softer sales activity, High River's market appears to be gaining momentum heading into summer.
Prices Continue to Show Strength
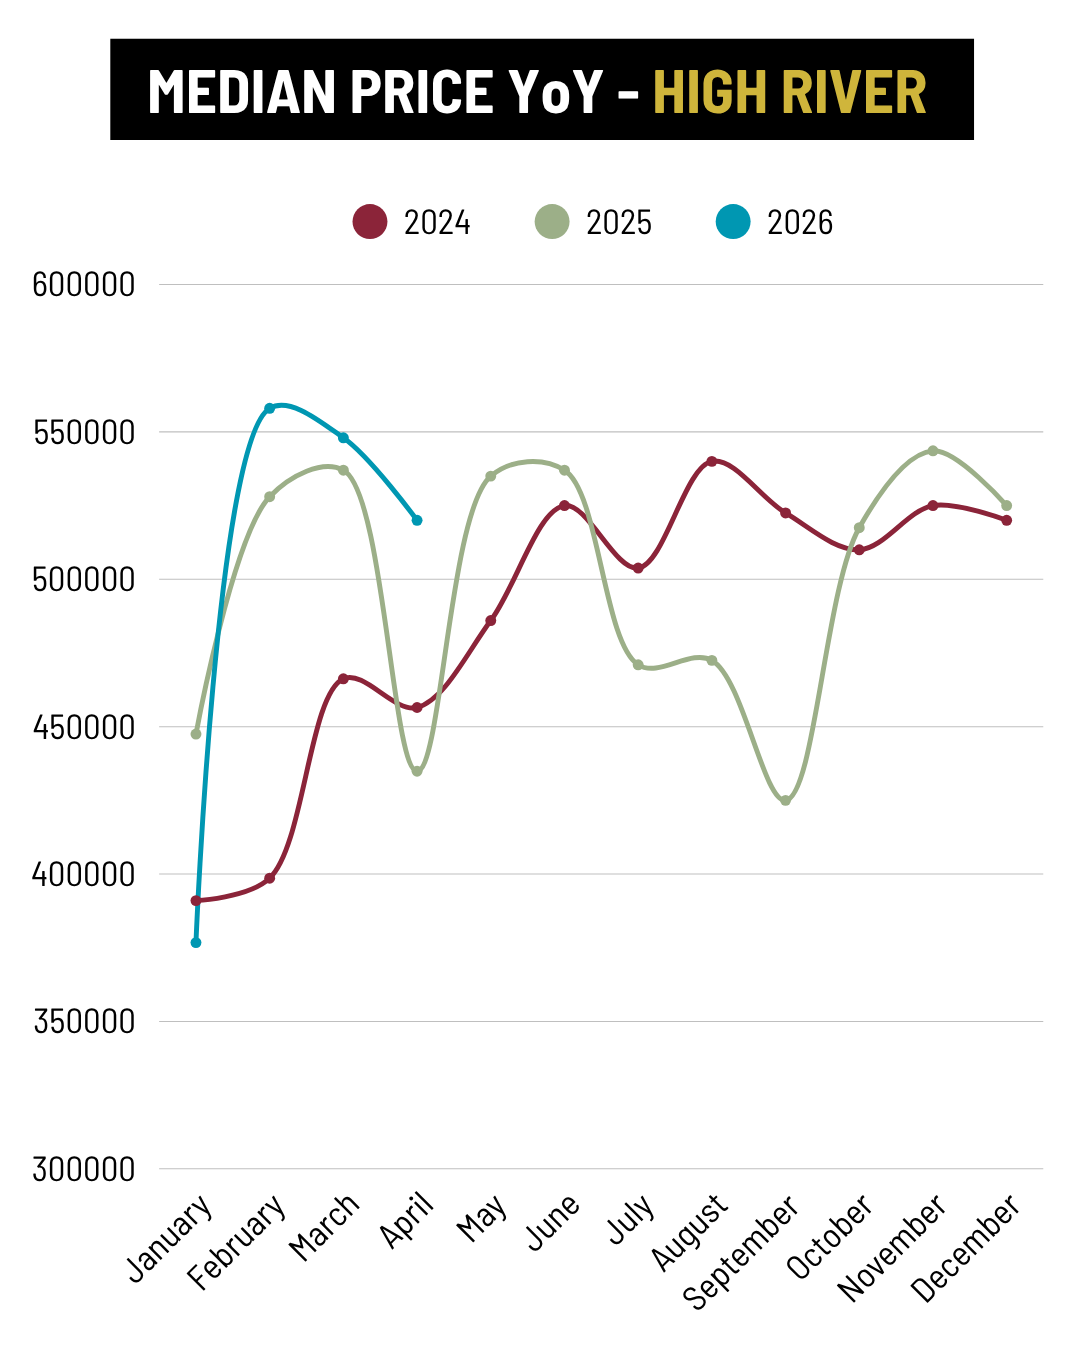
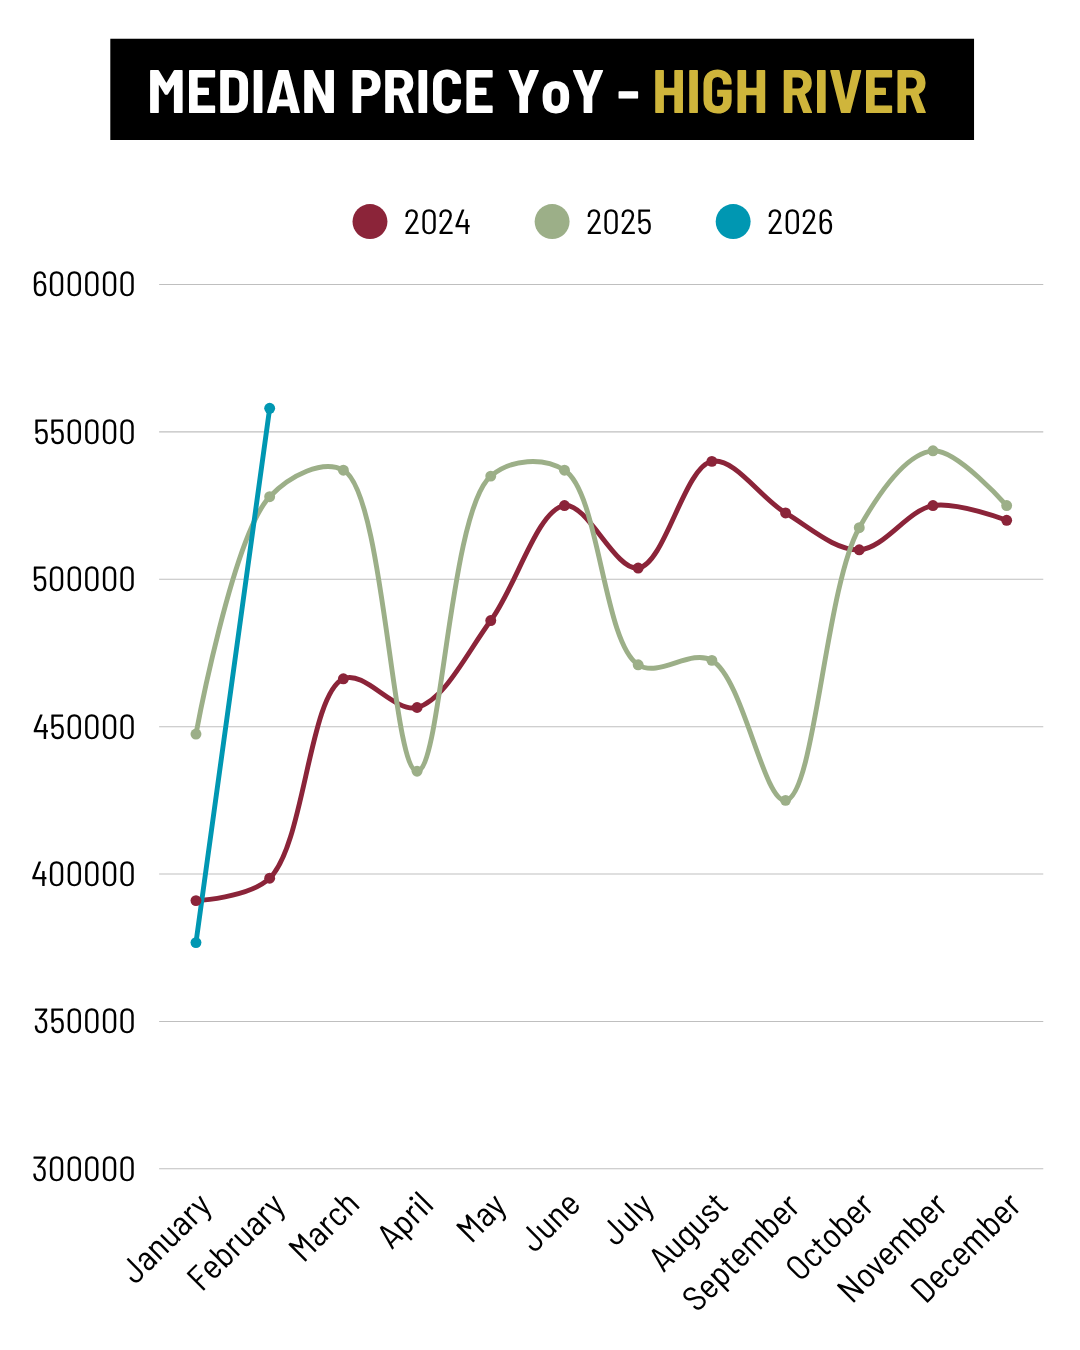
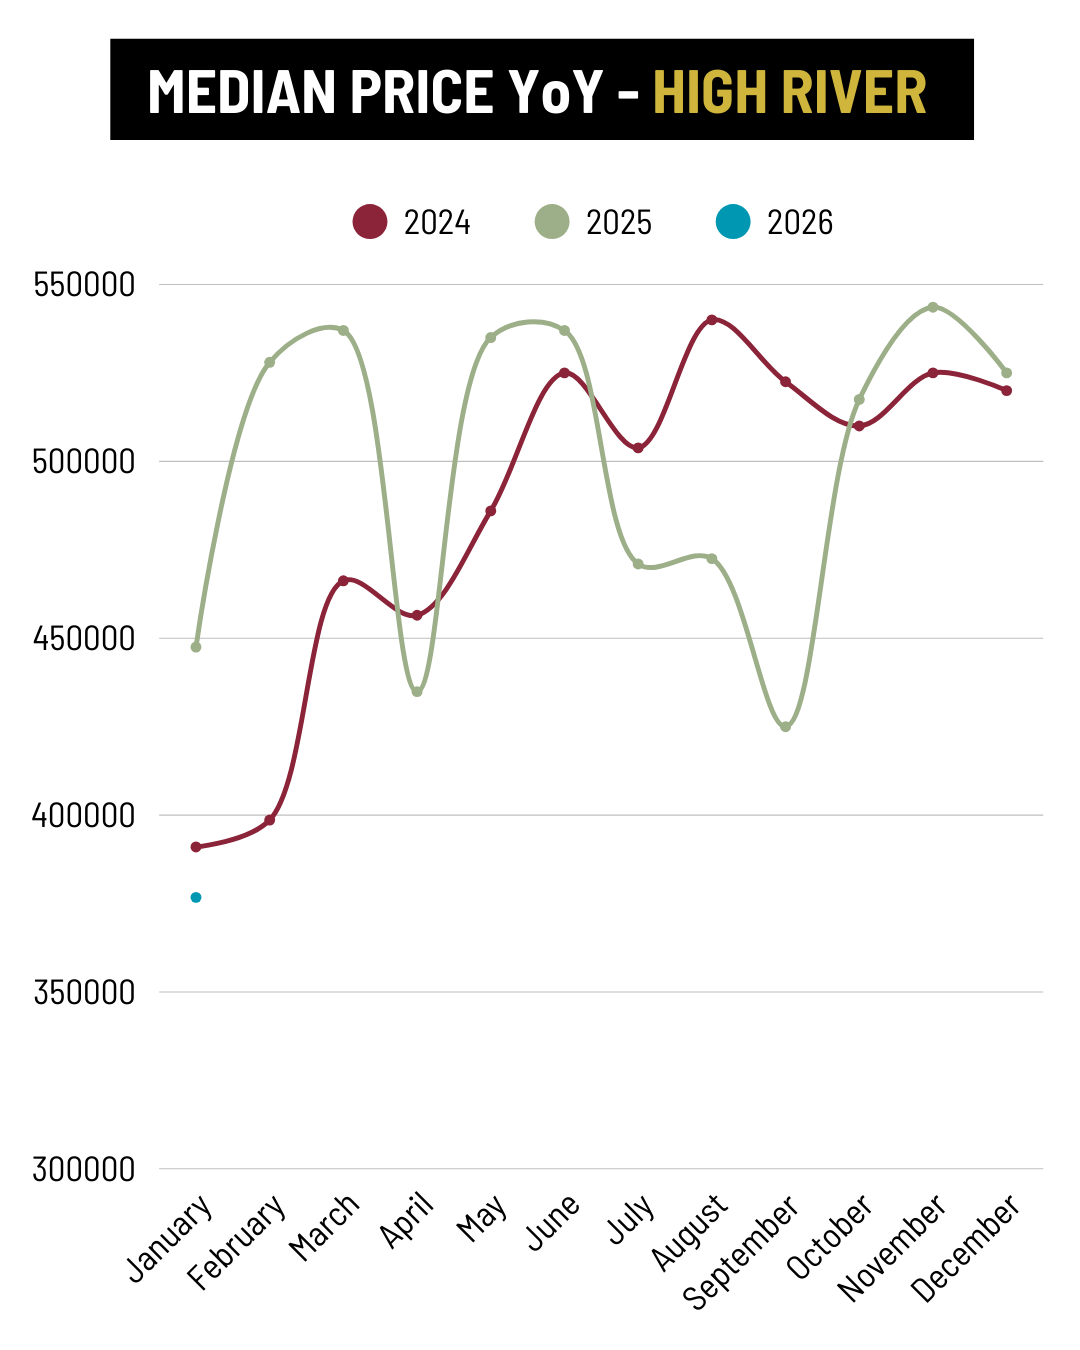
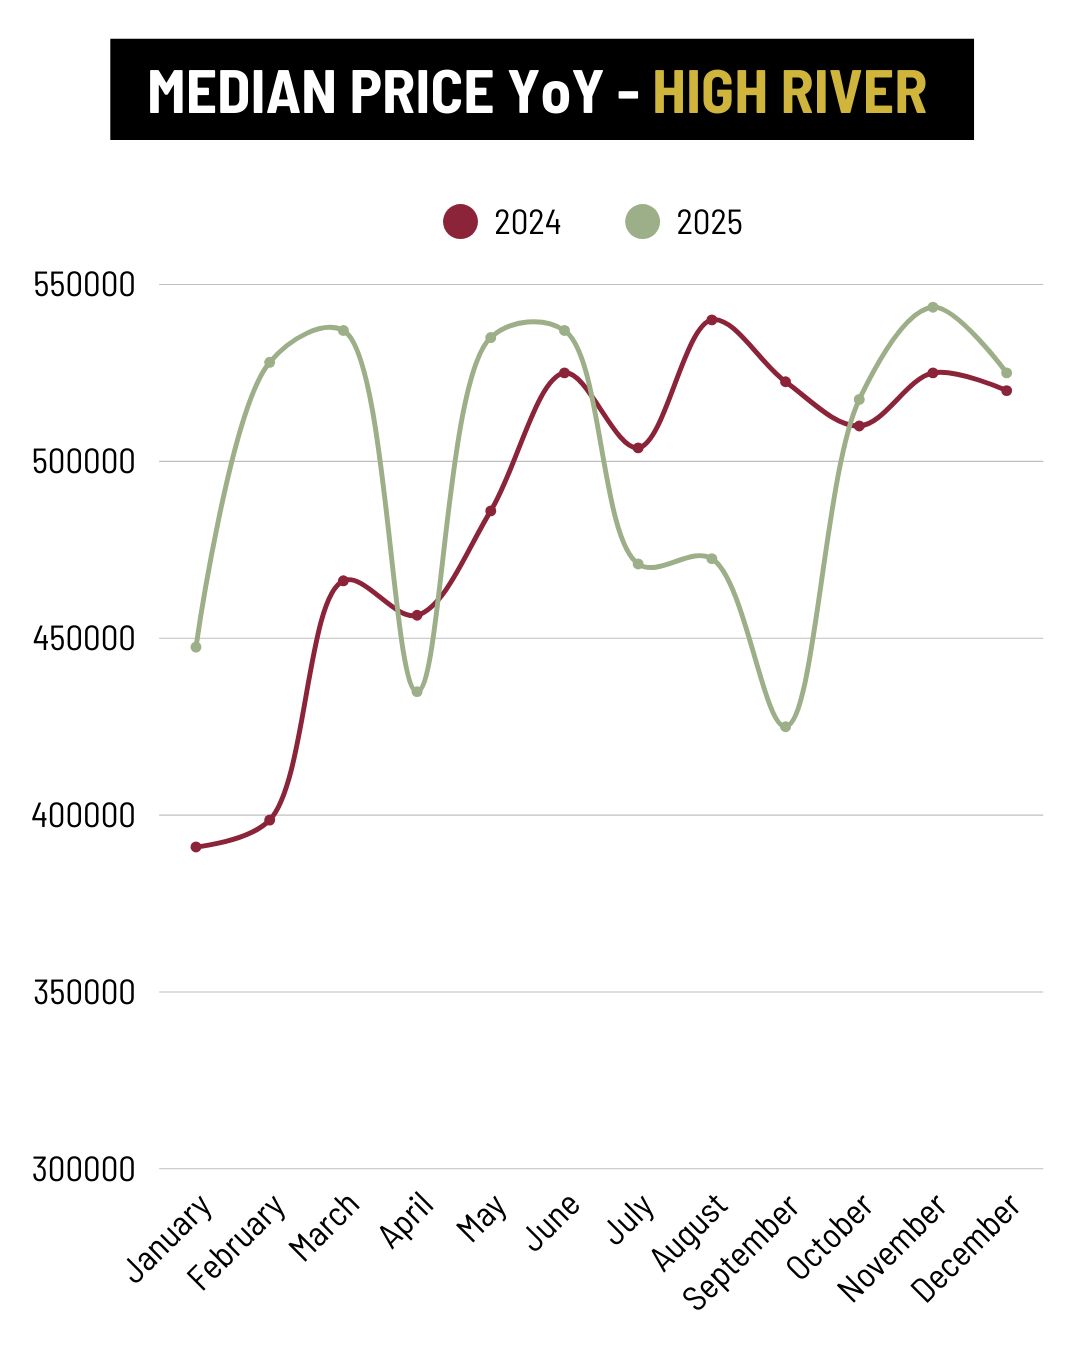
The median sale price reached $568,750 in May, up 6% year-over-year.
Compared to neighbouring markets:
- High River $568,750 +6%
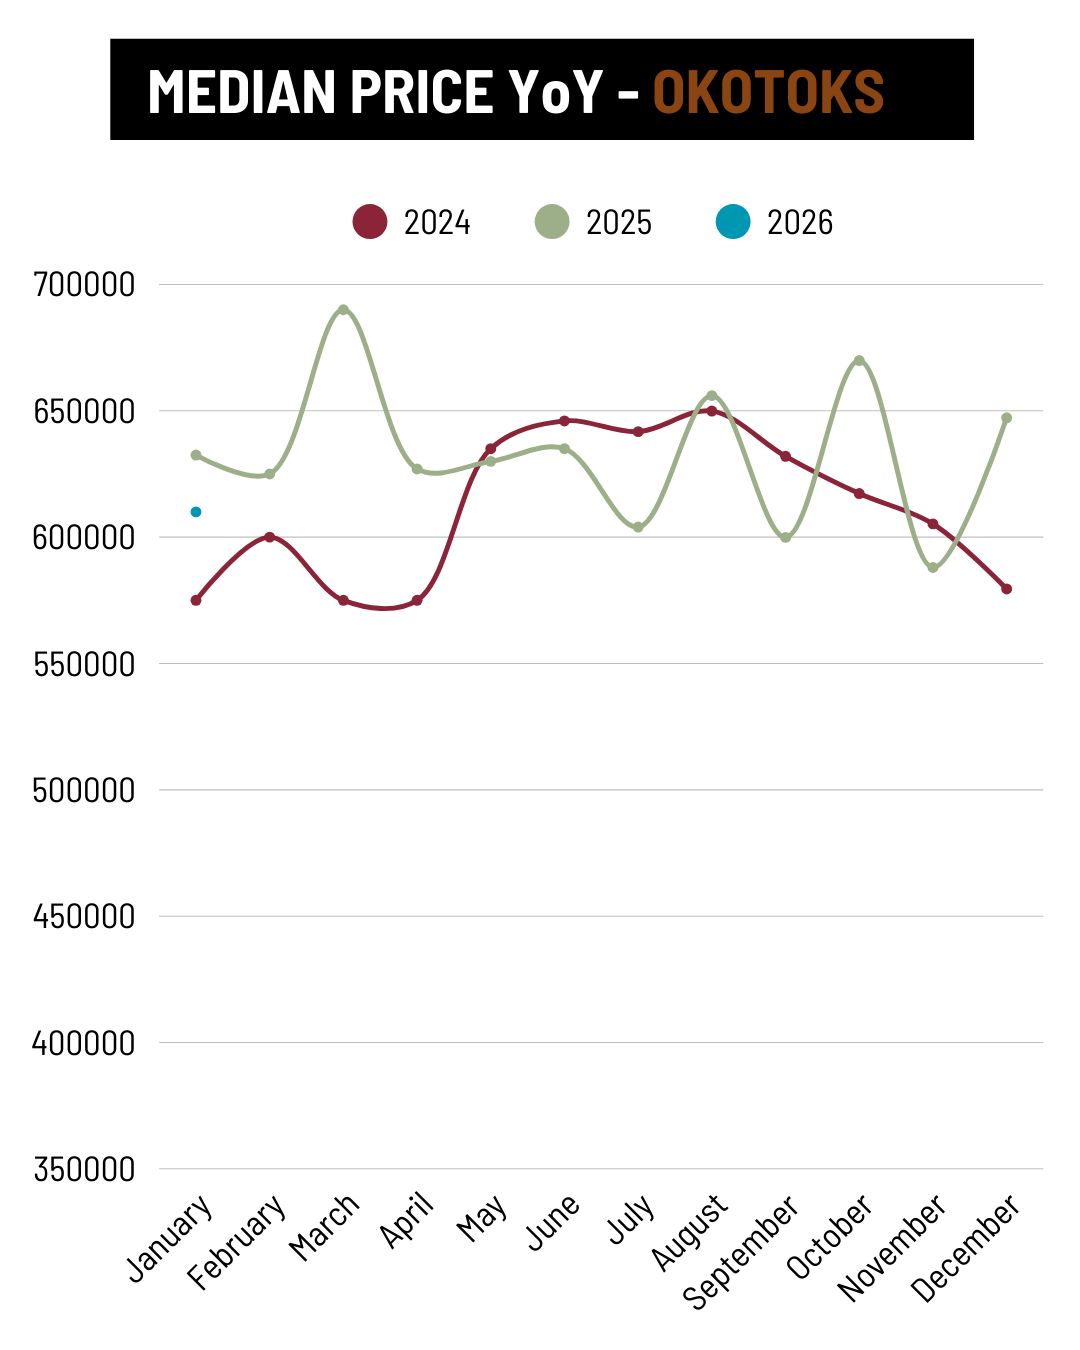
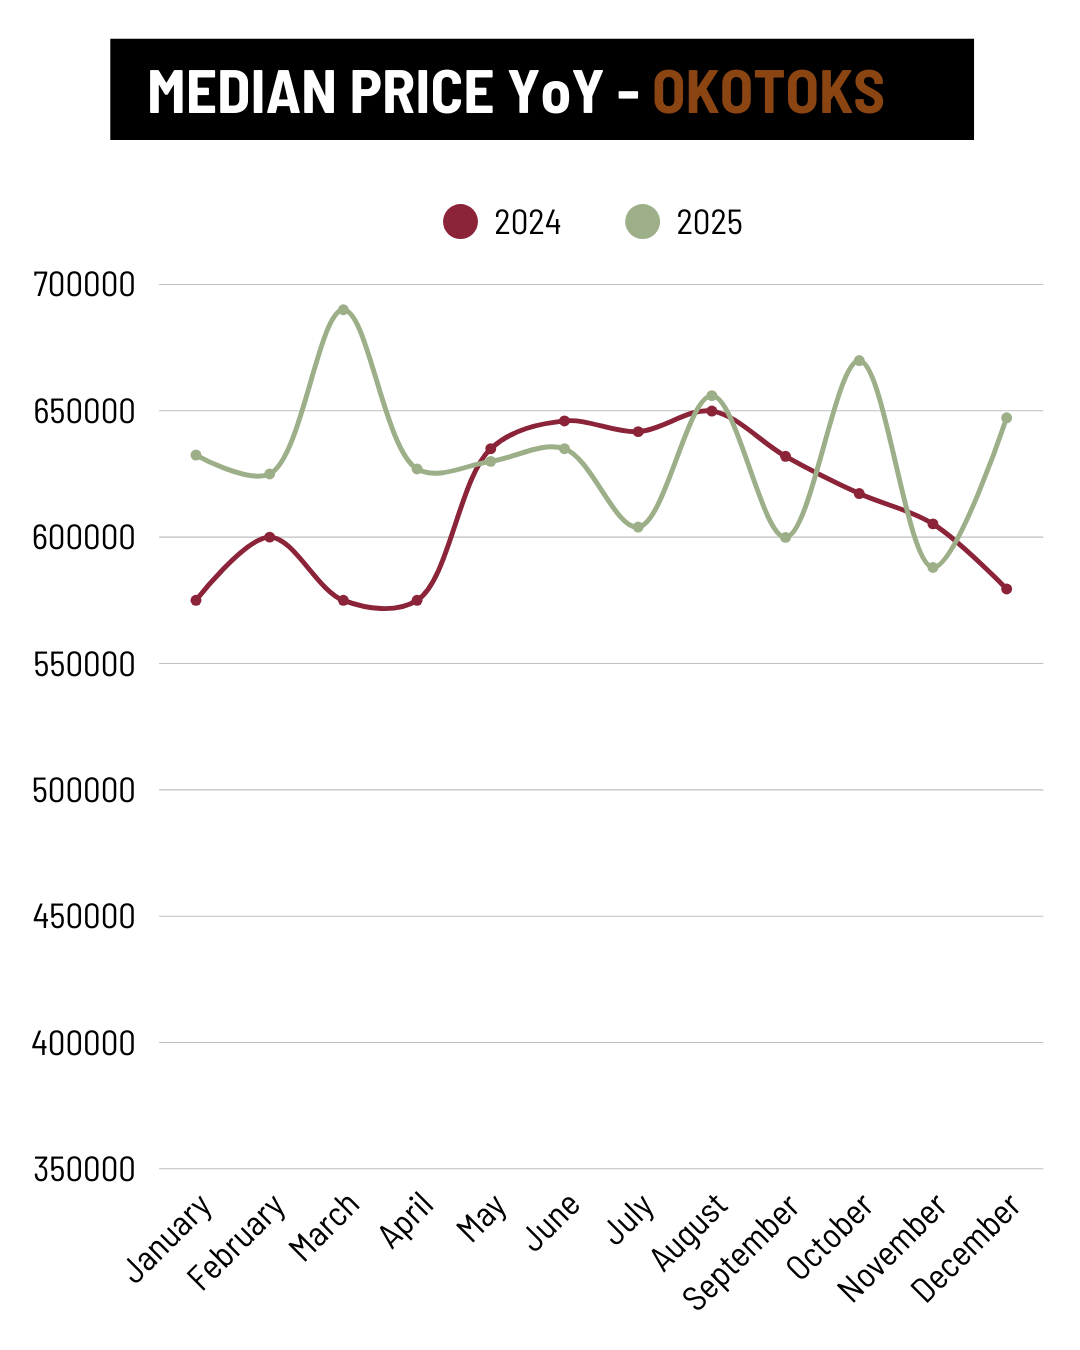
- Okotoks $672,000 +7%
- Calgary $592,250 0%
While monthly median prices can fluctuate based on the mix of homes sold, High River continues to show healthy price appreciation.
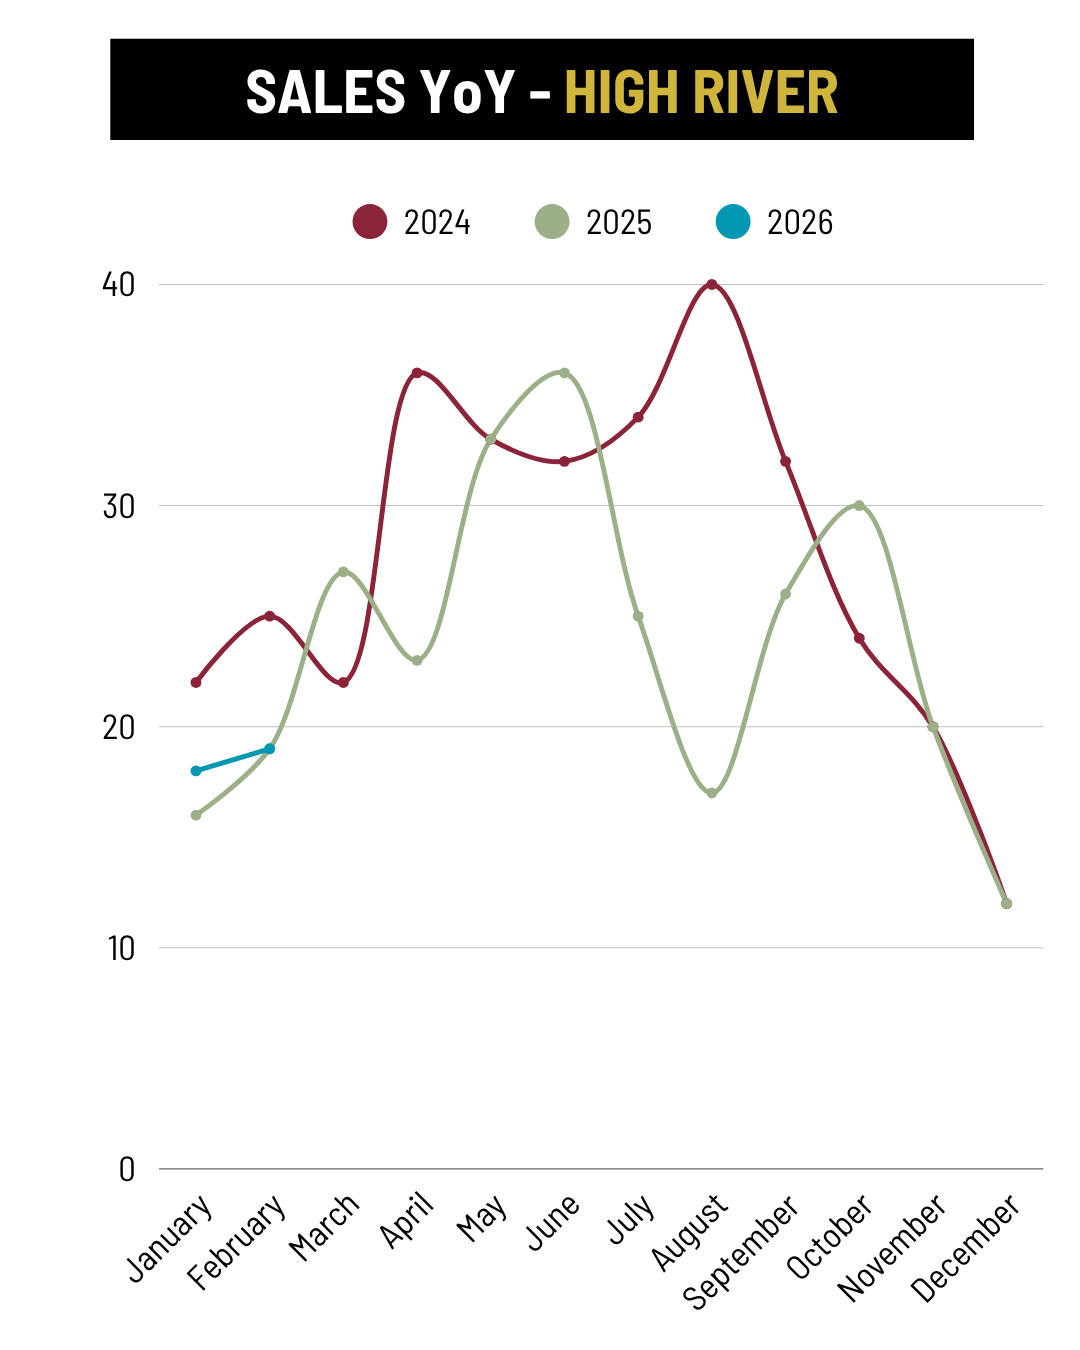
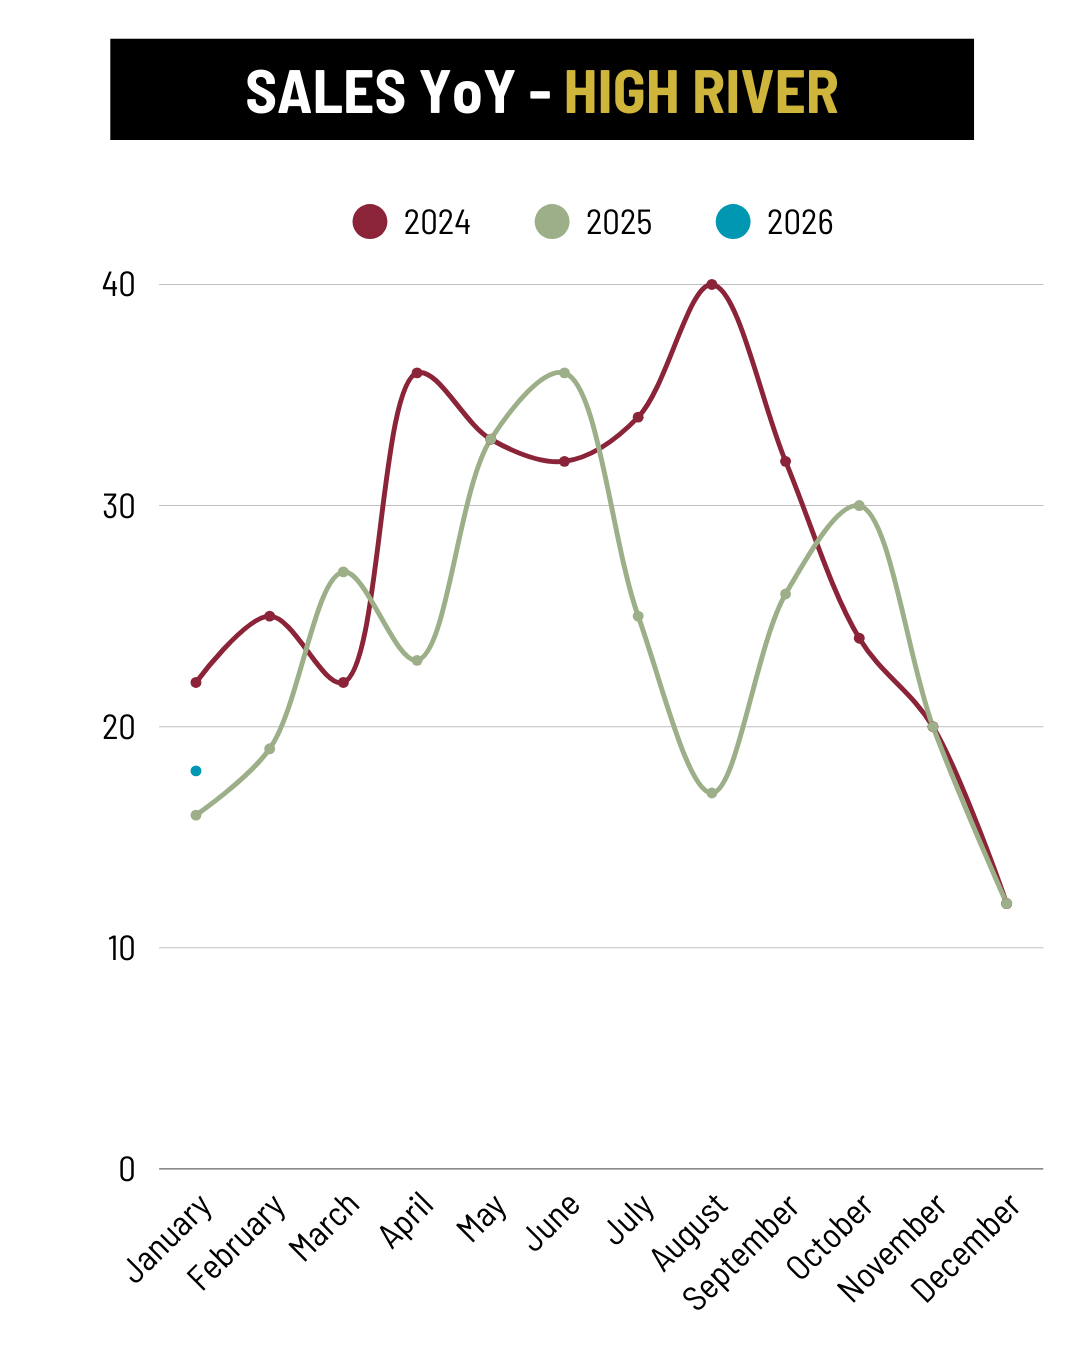
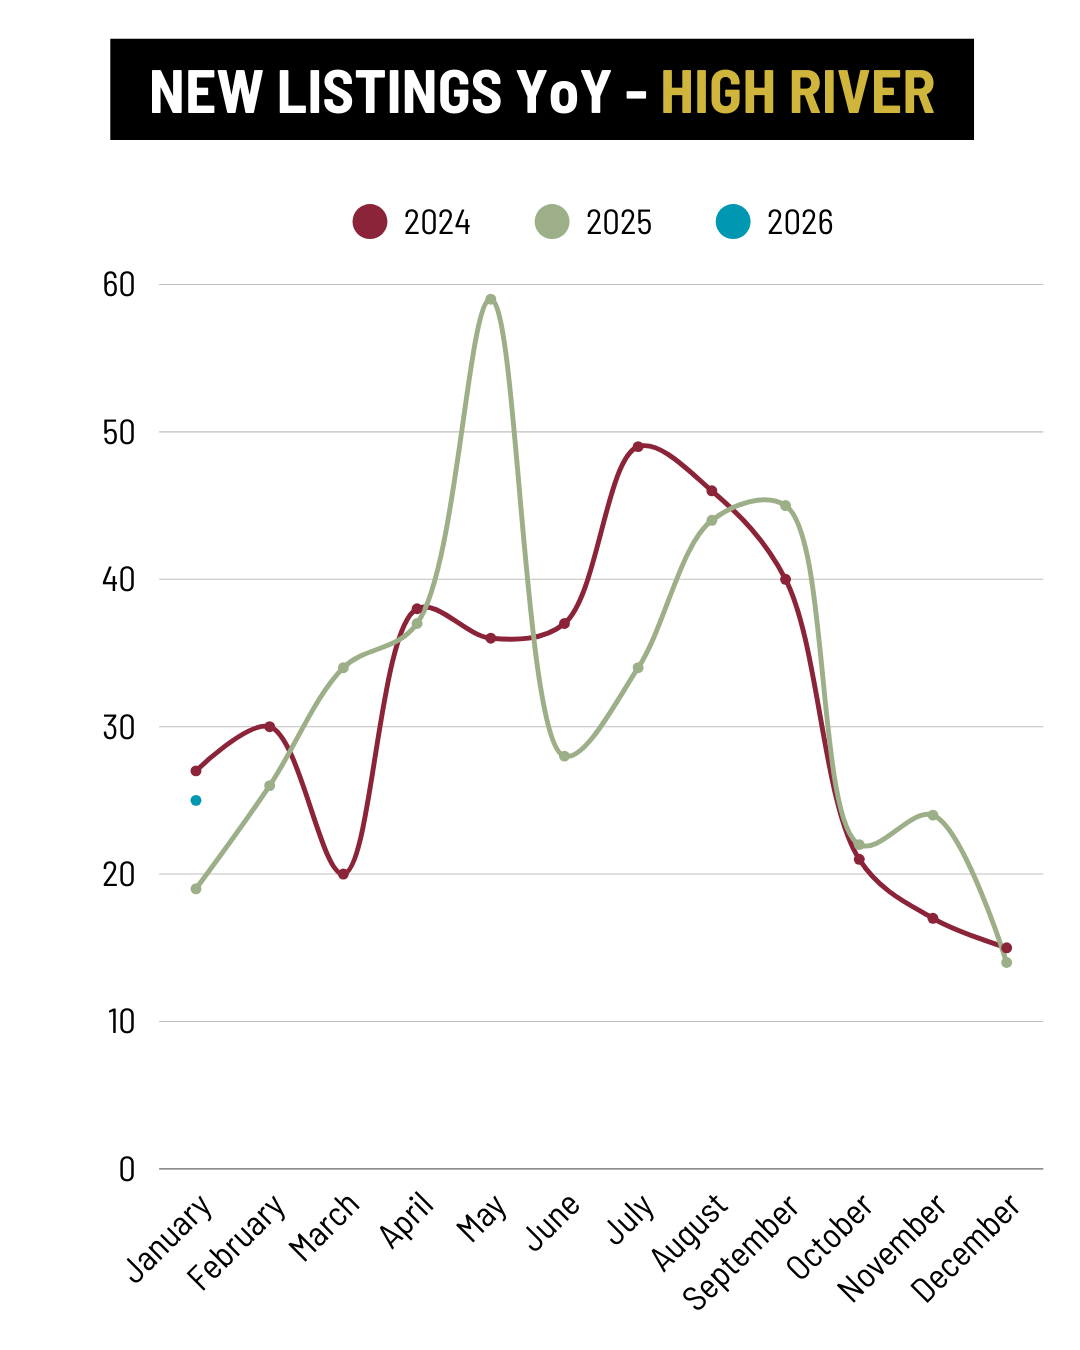
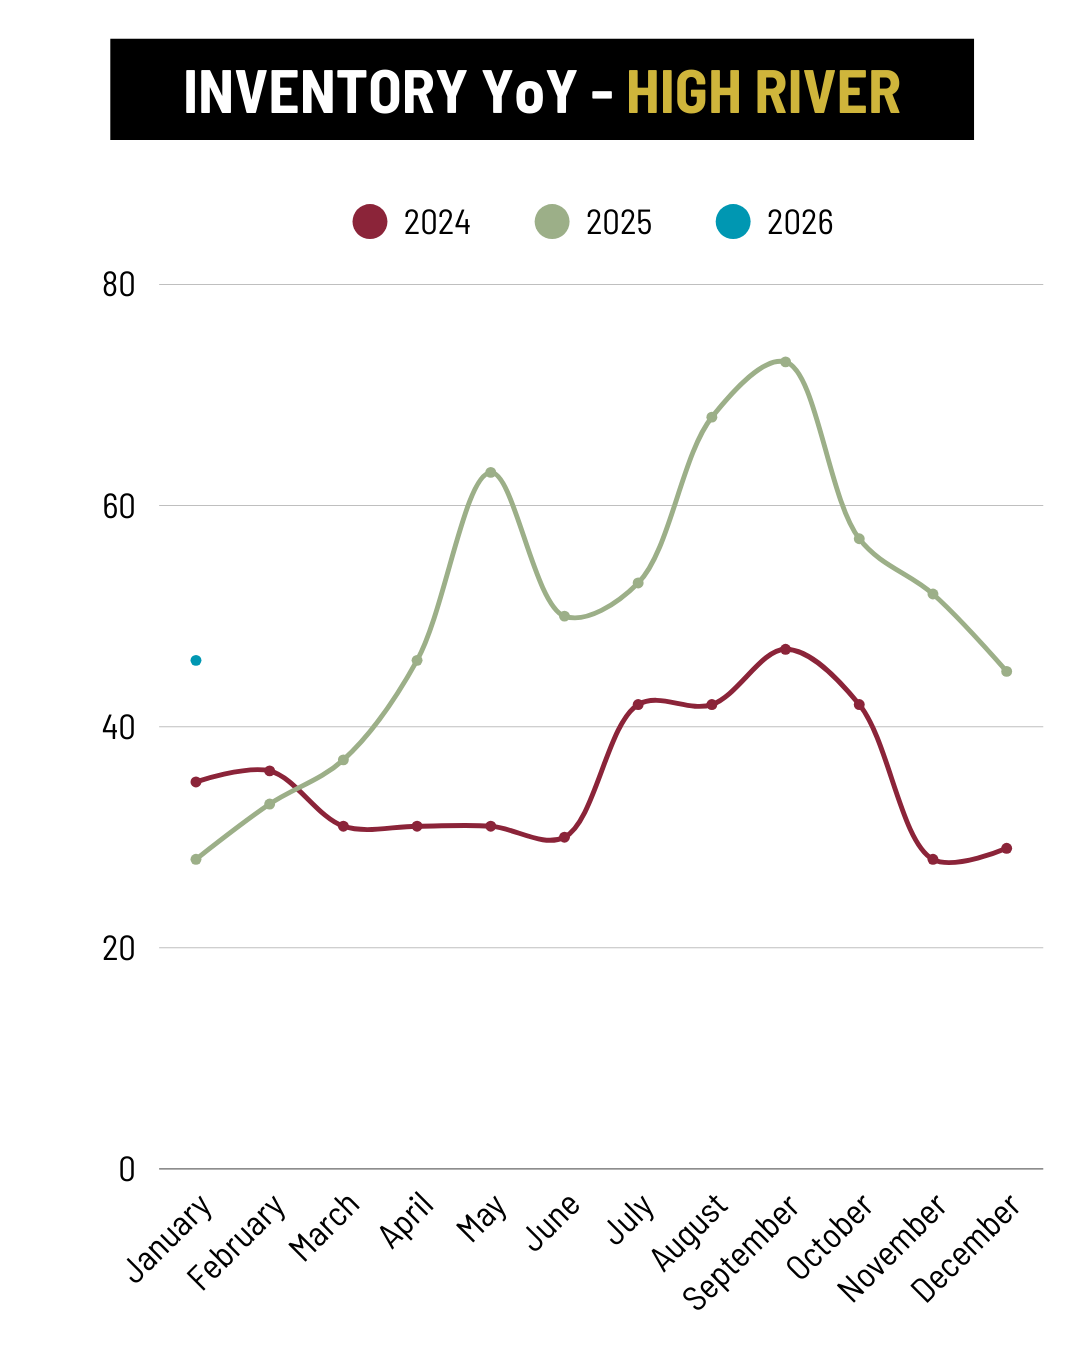
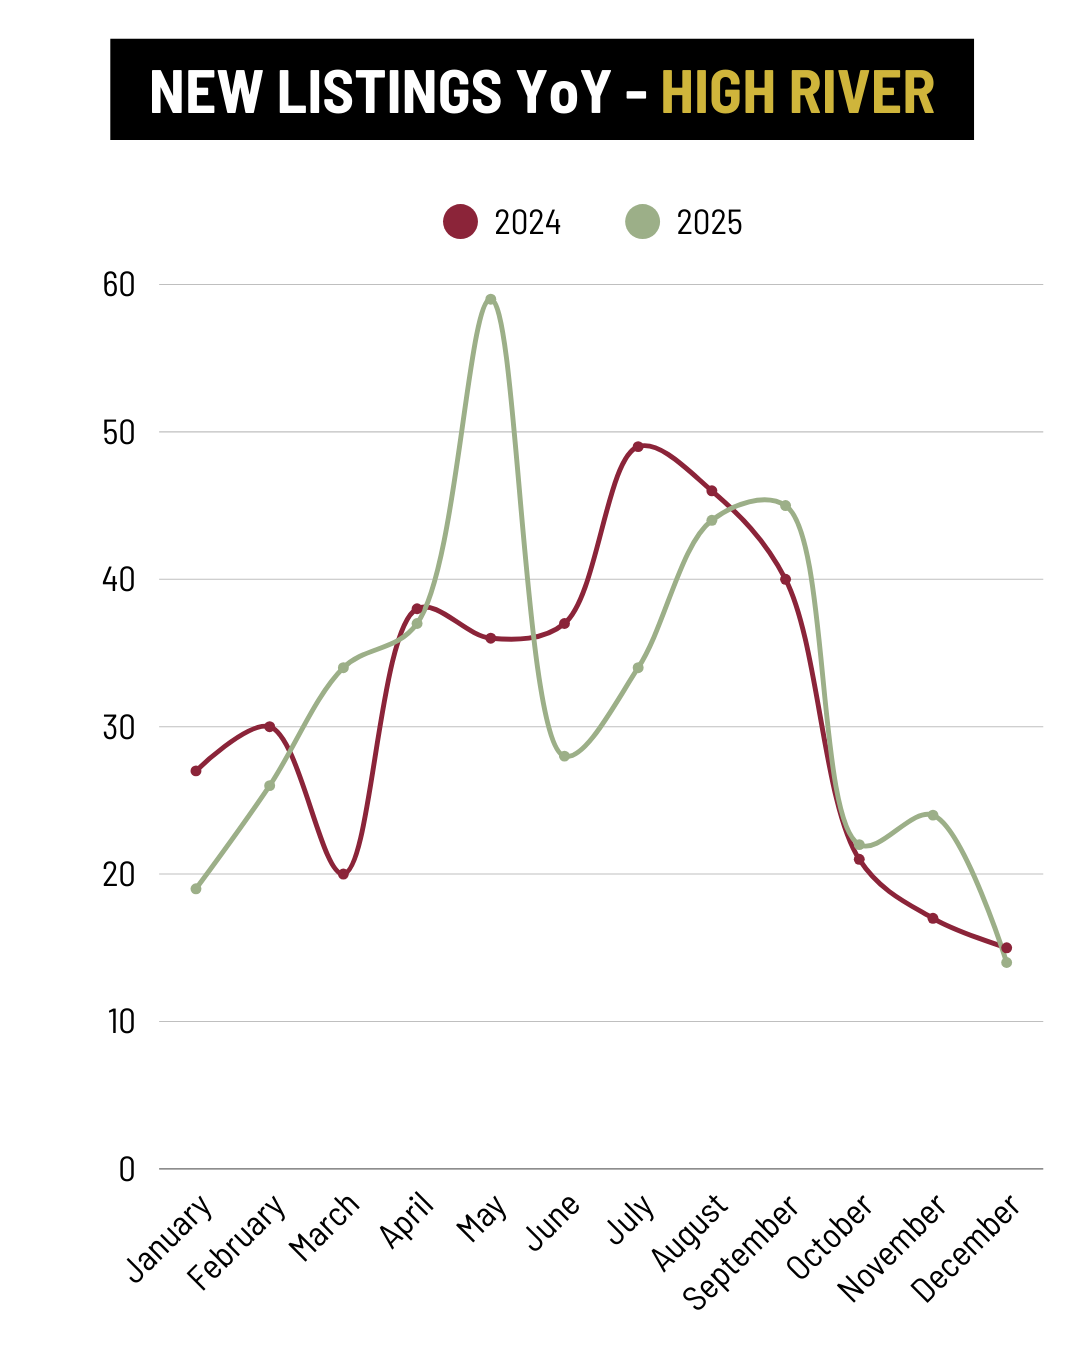
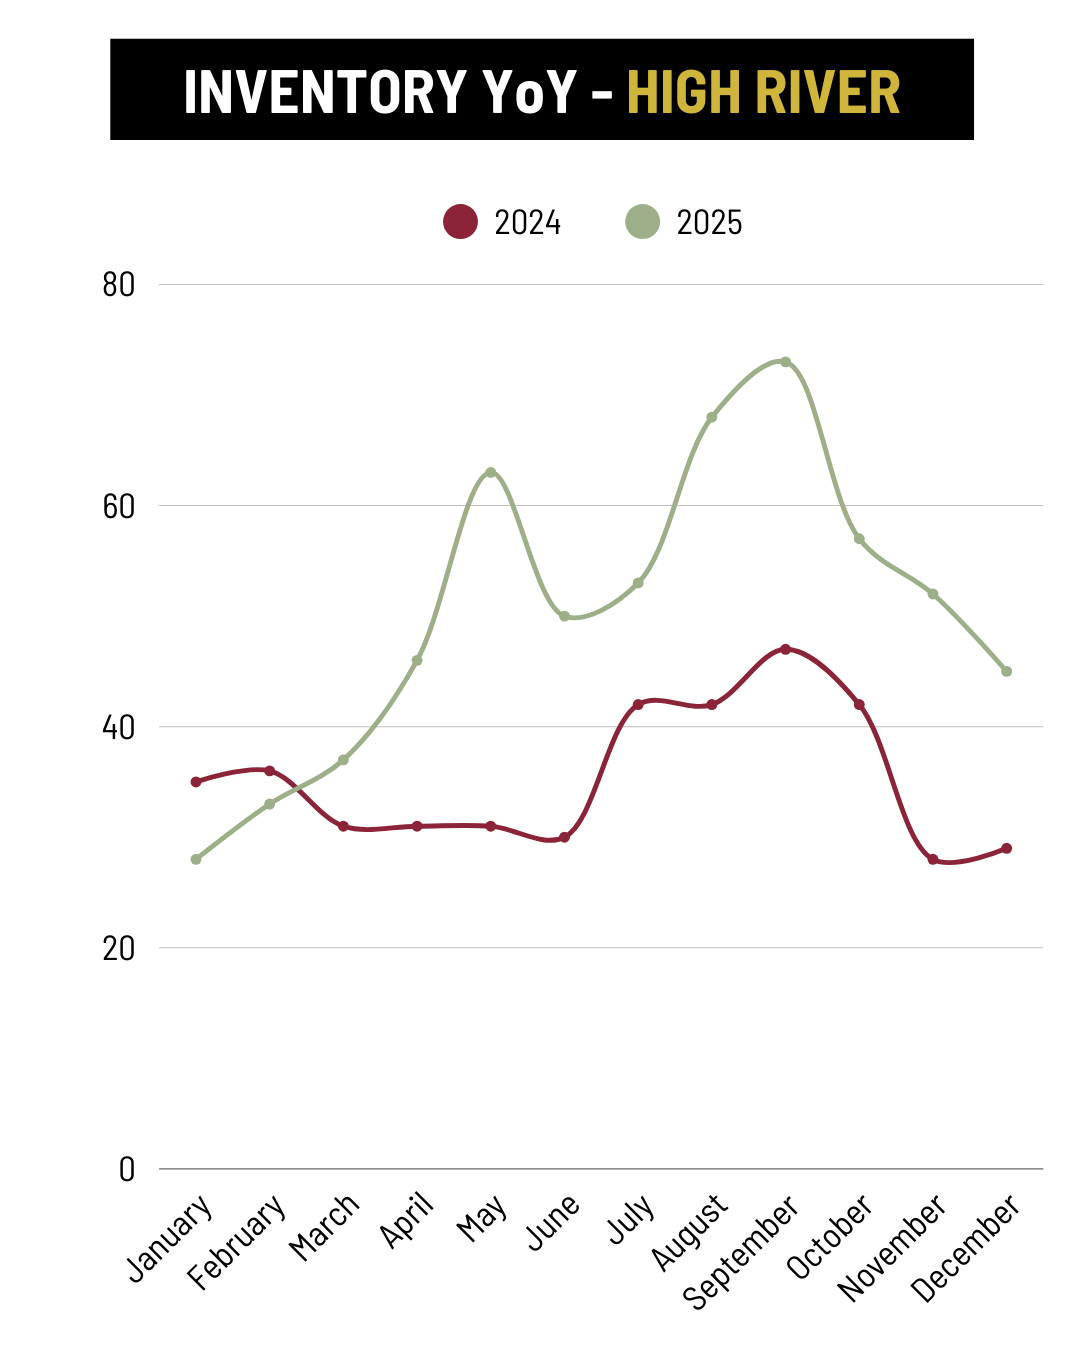
Sales Rise While New Listings Fall
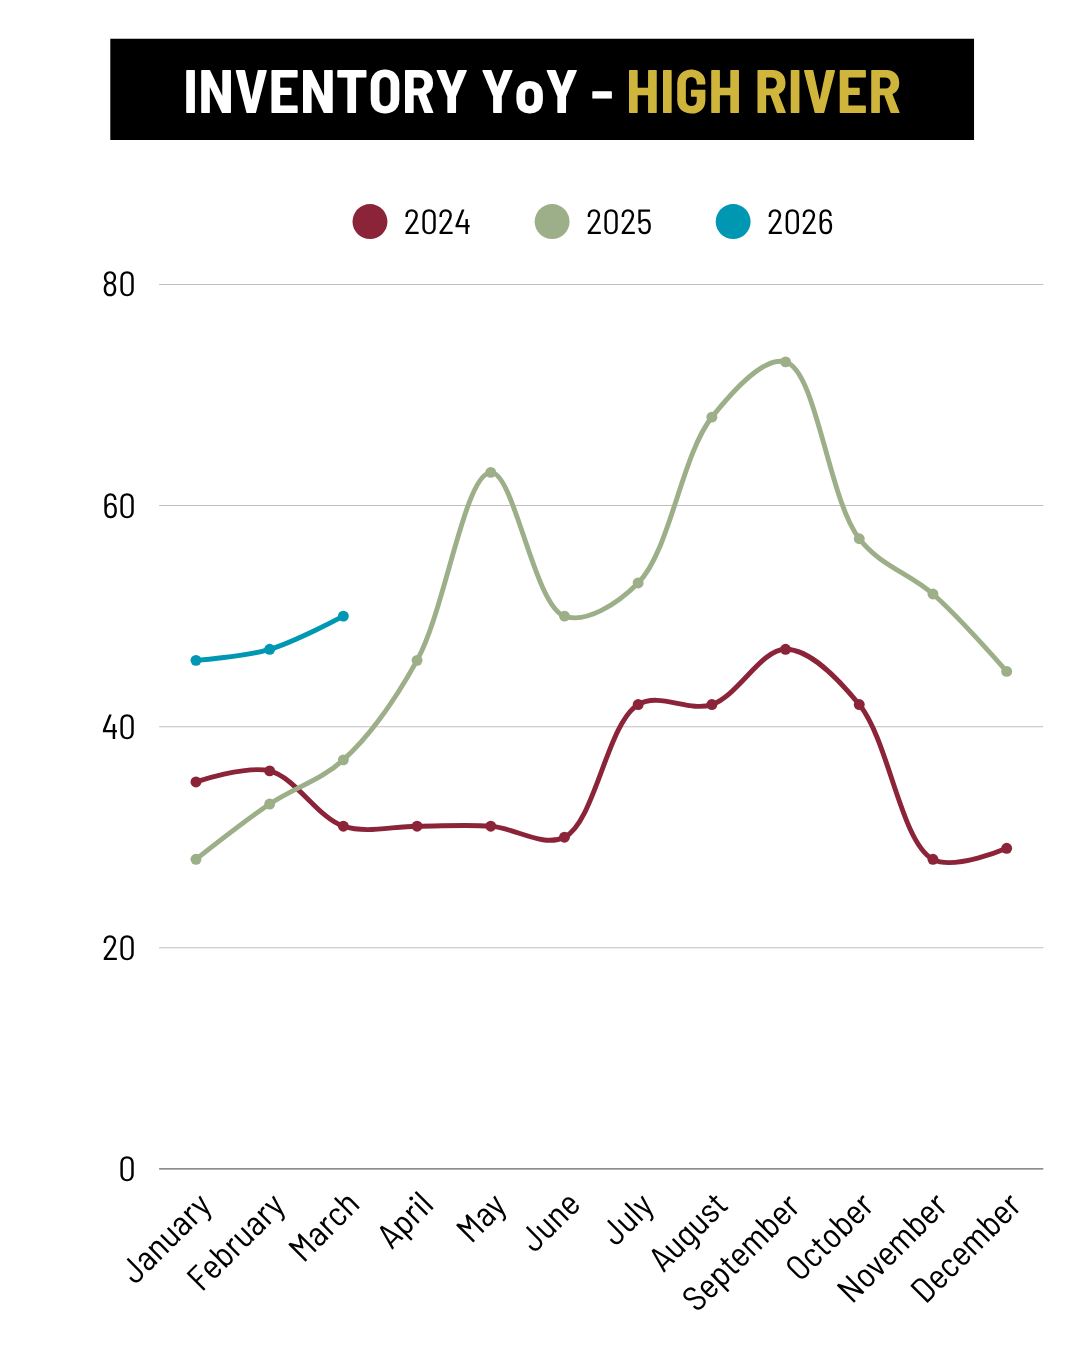
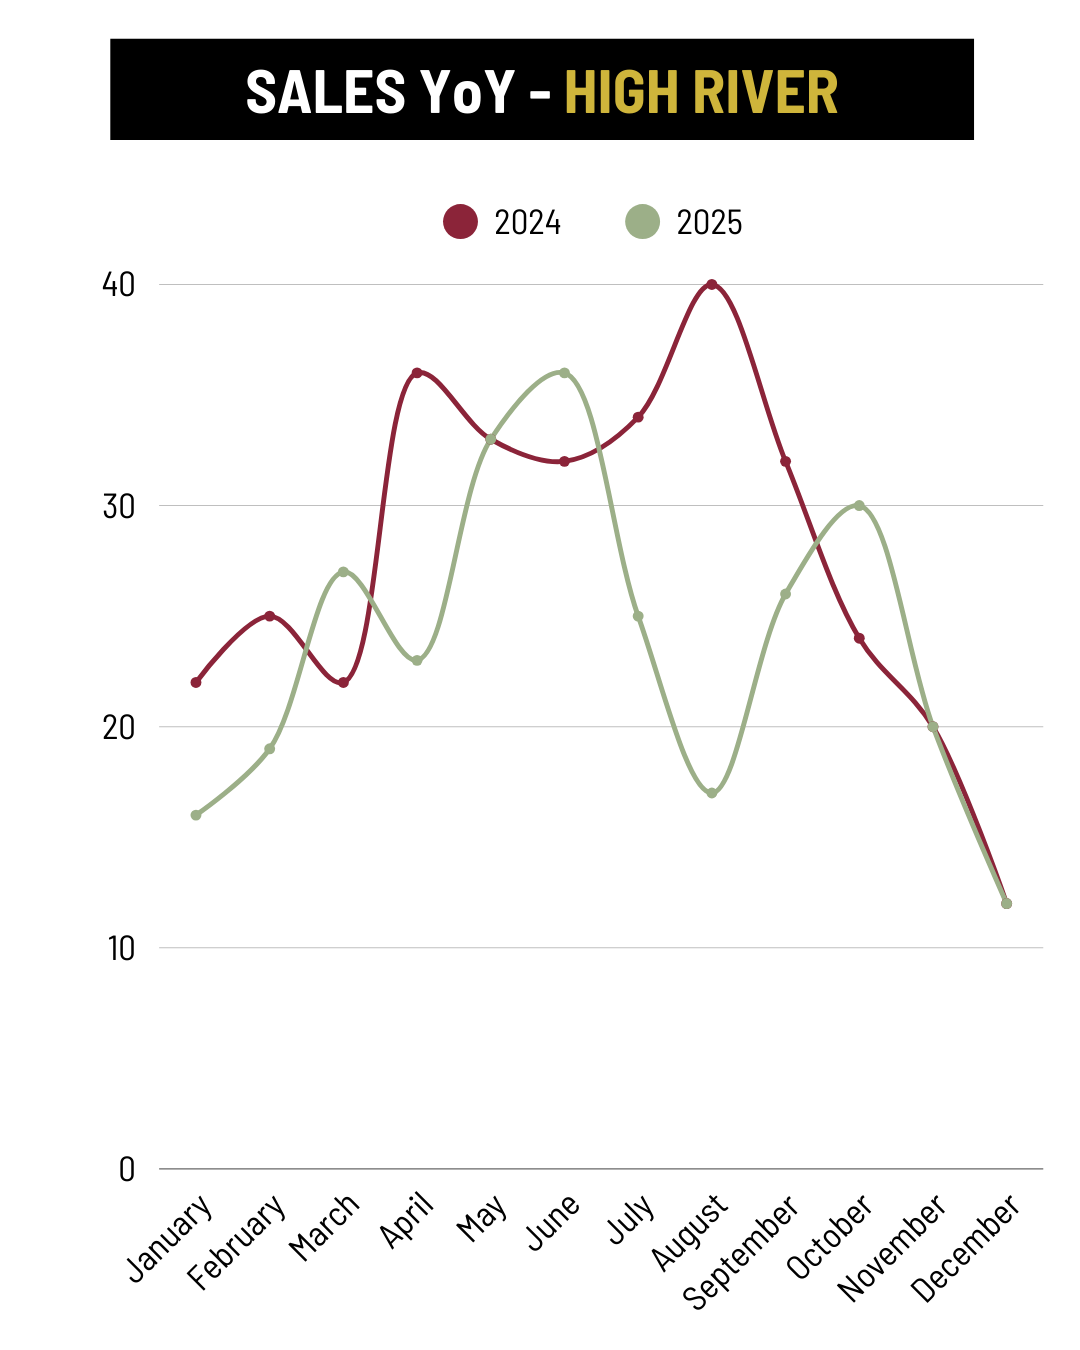
One of the most encouraging signs in May was the improvement in market absorption.
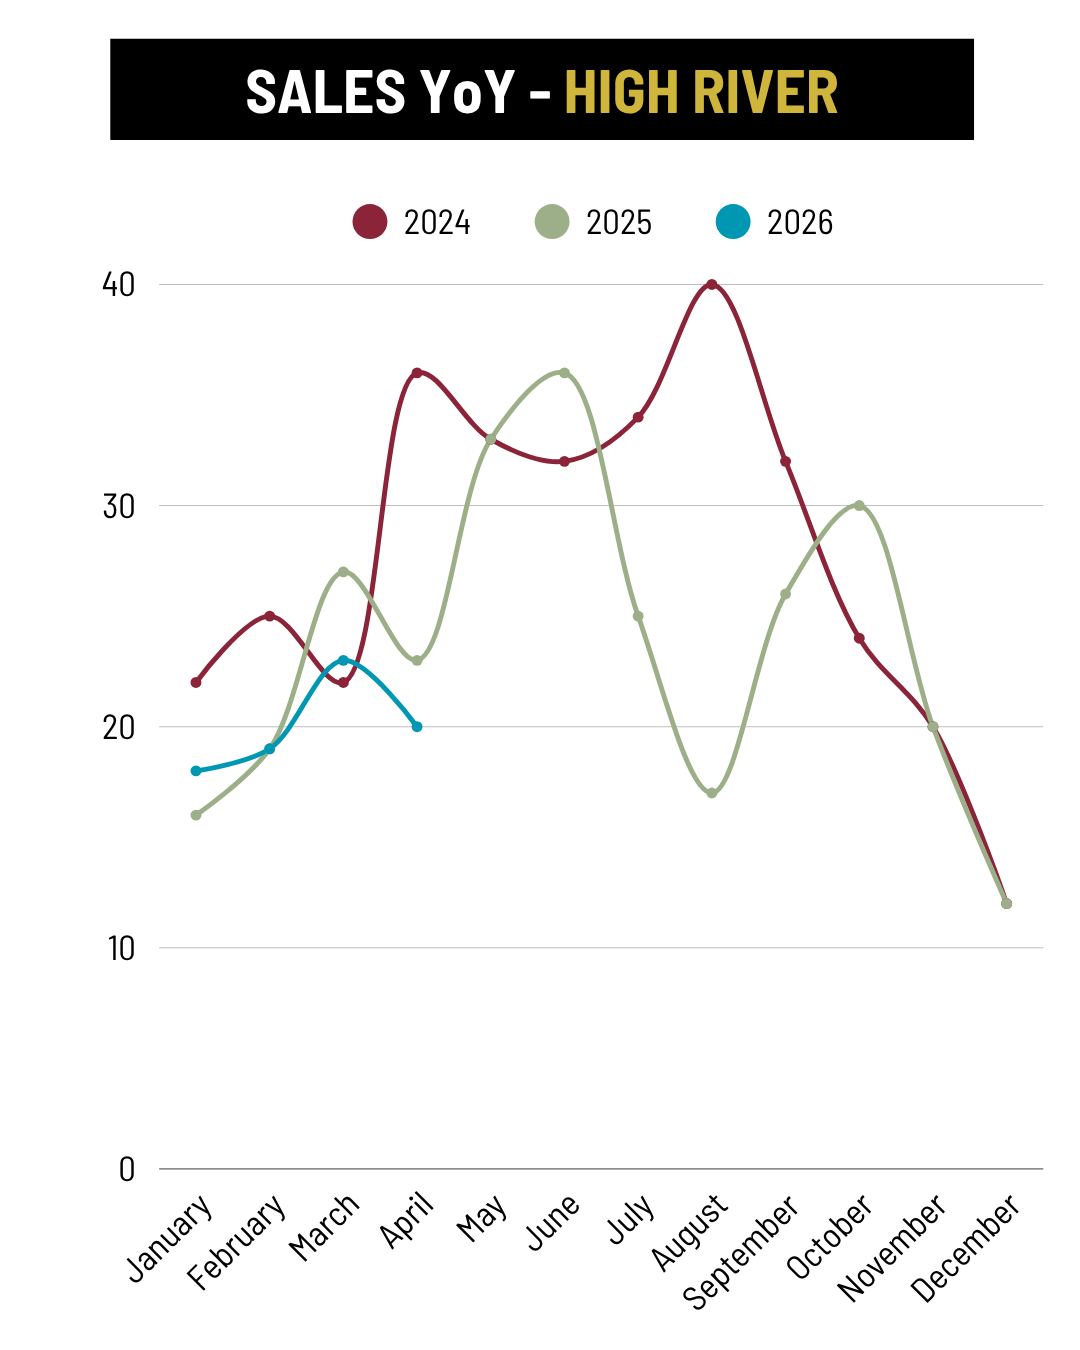
- Sales increased 9% YoY
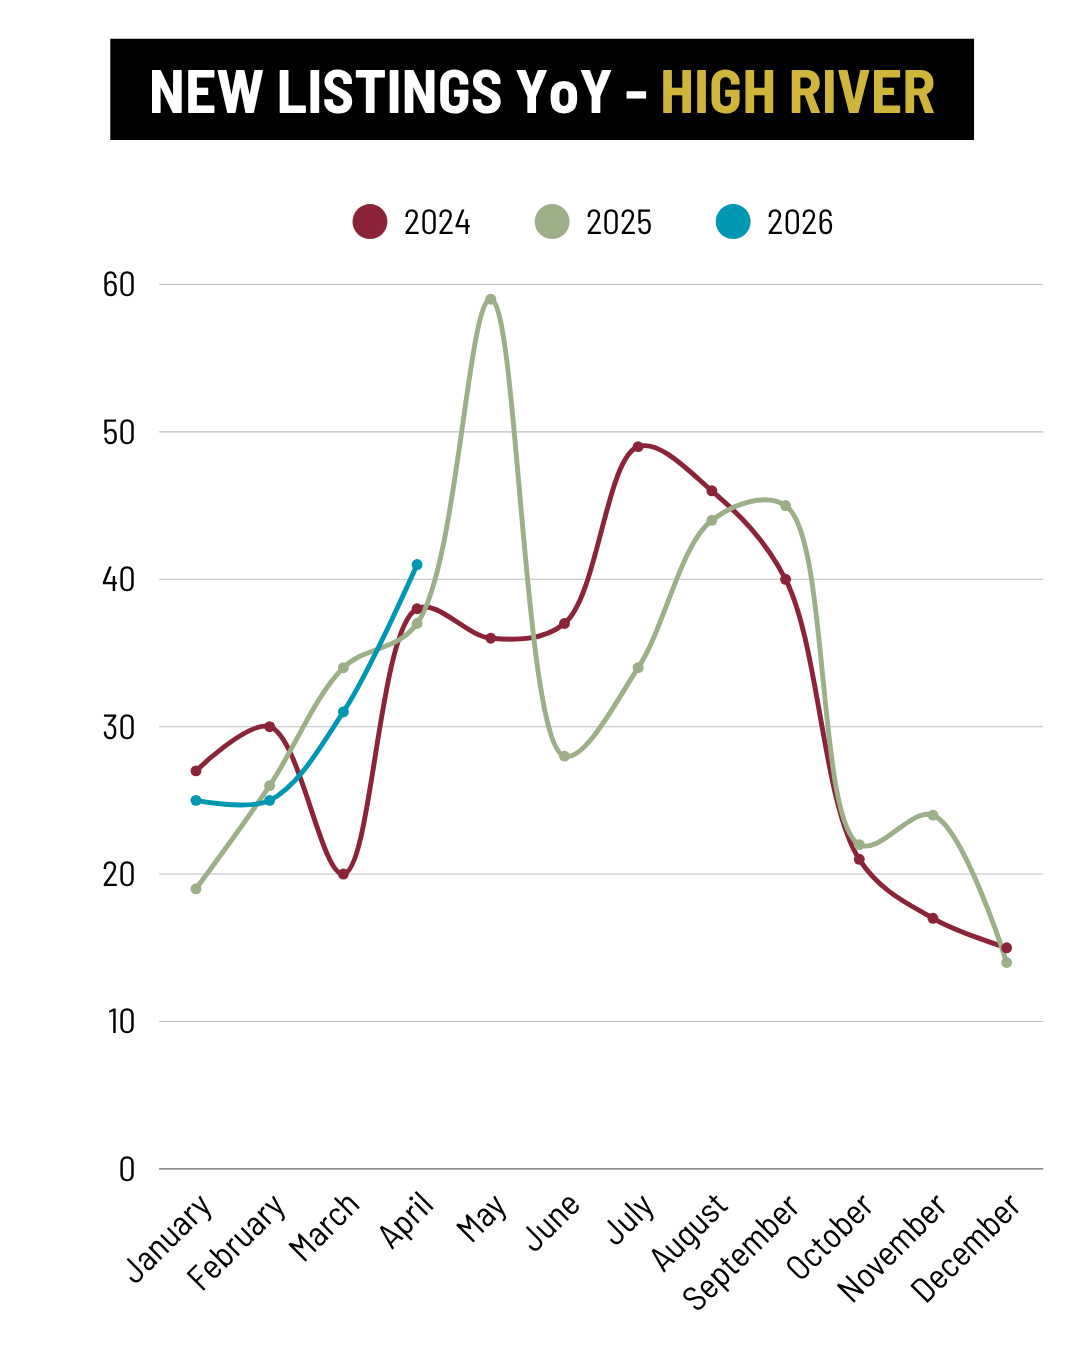
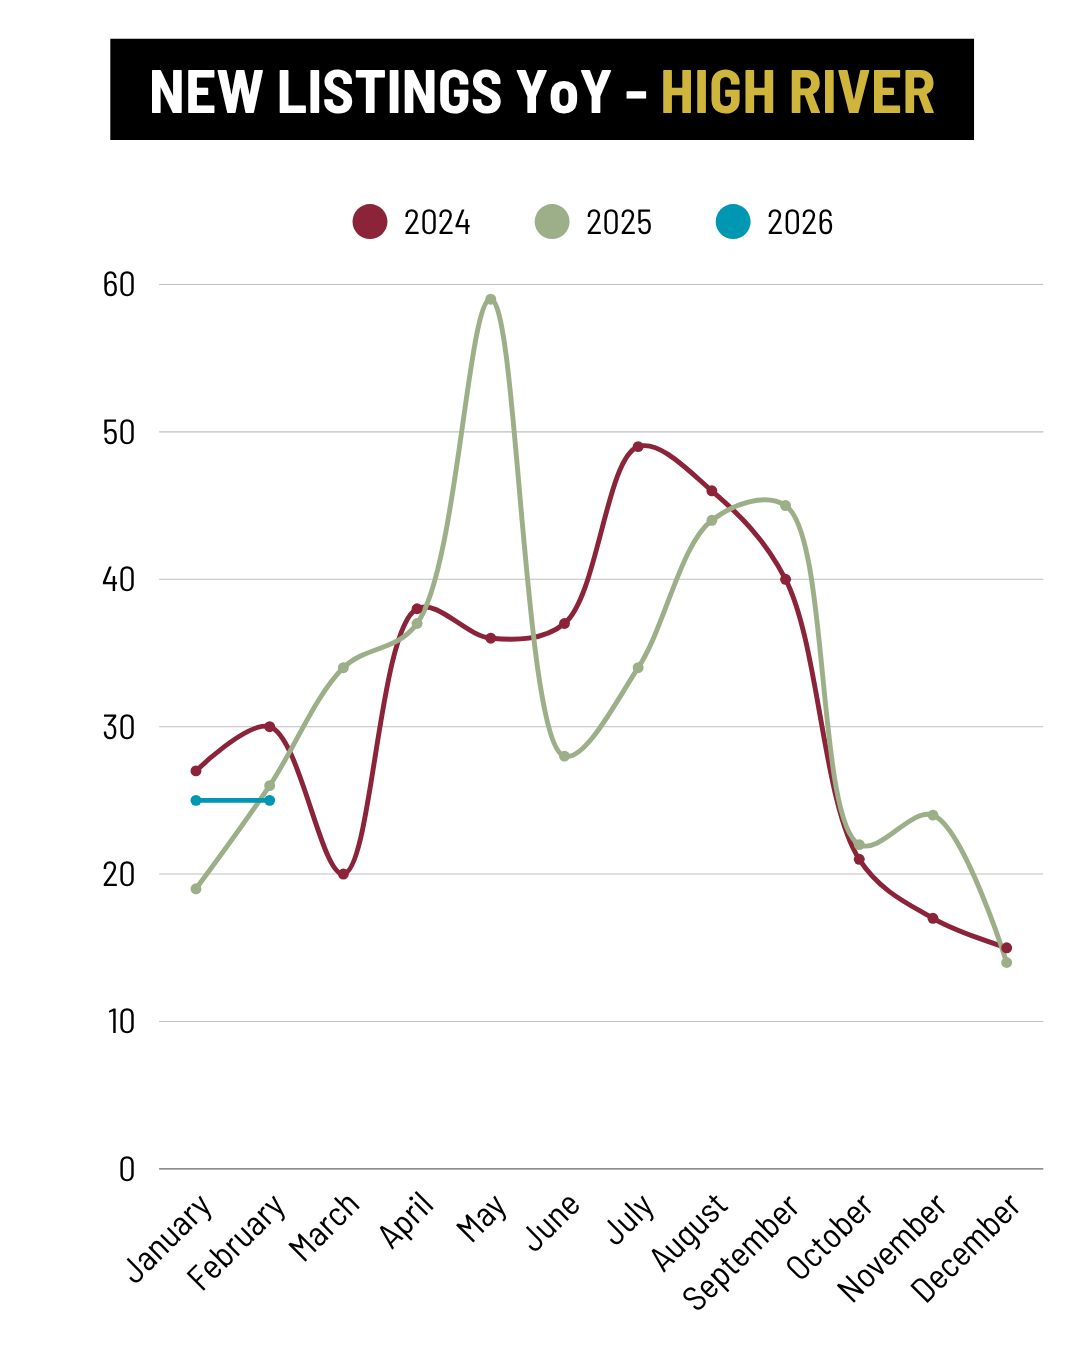
- New listings declined 17% YoY
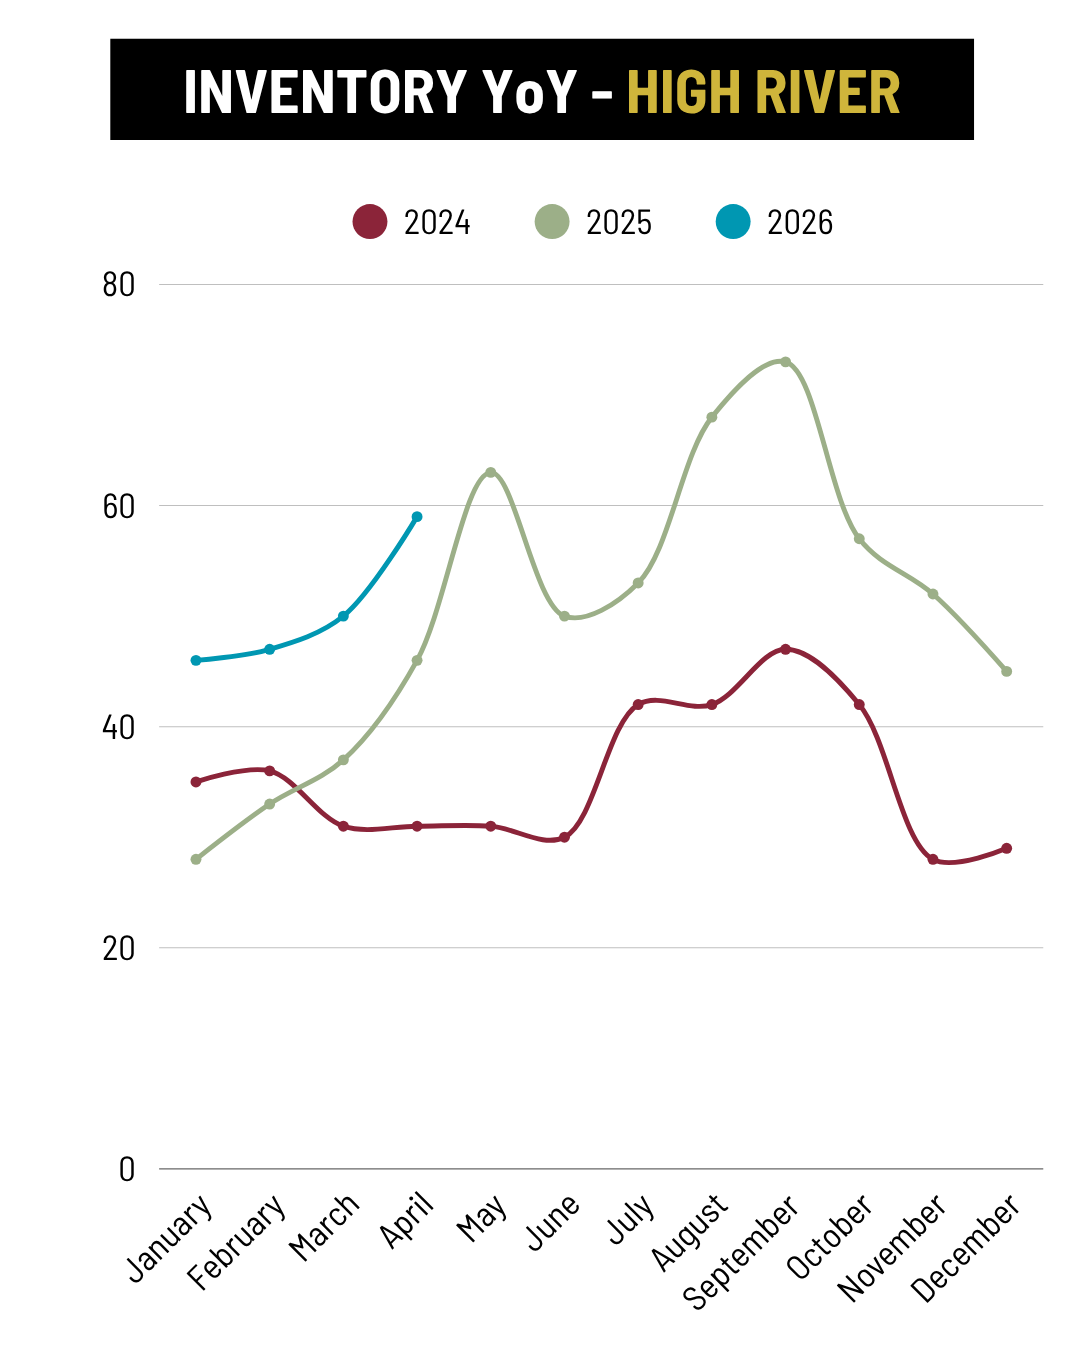
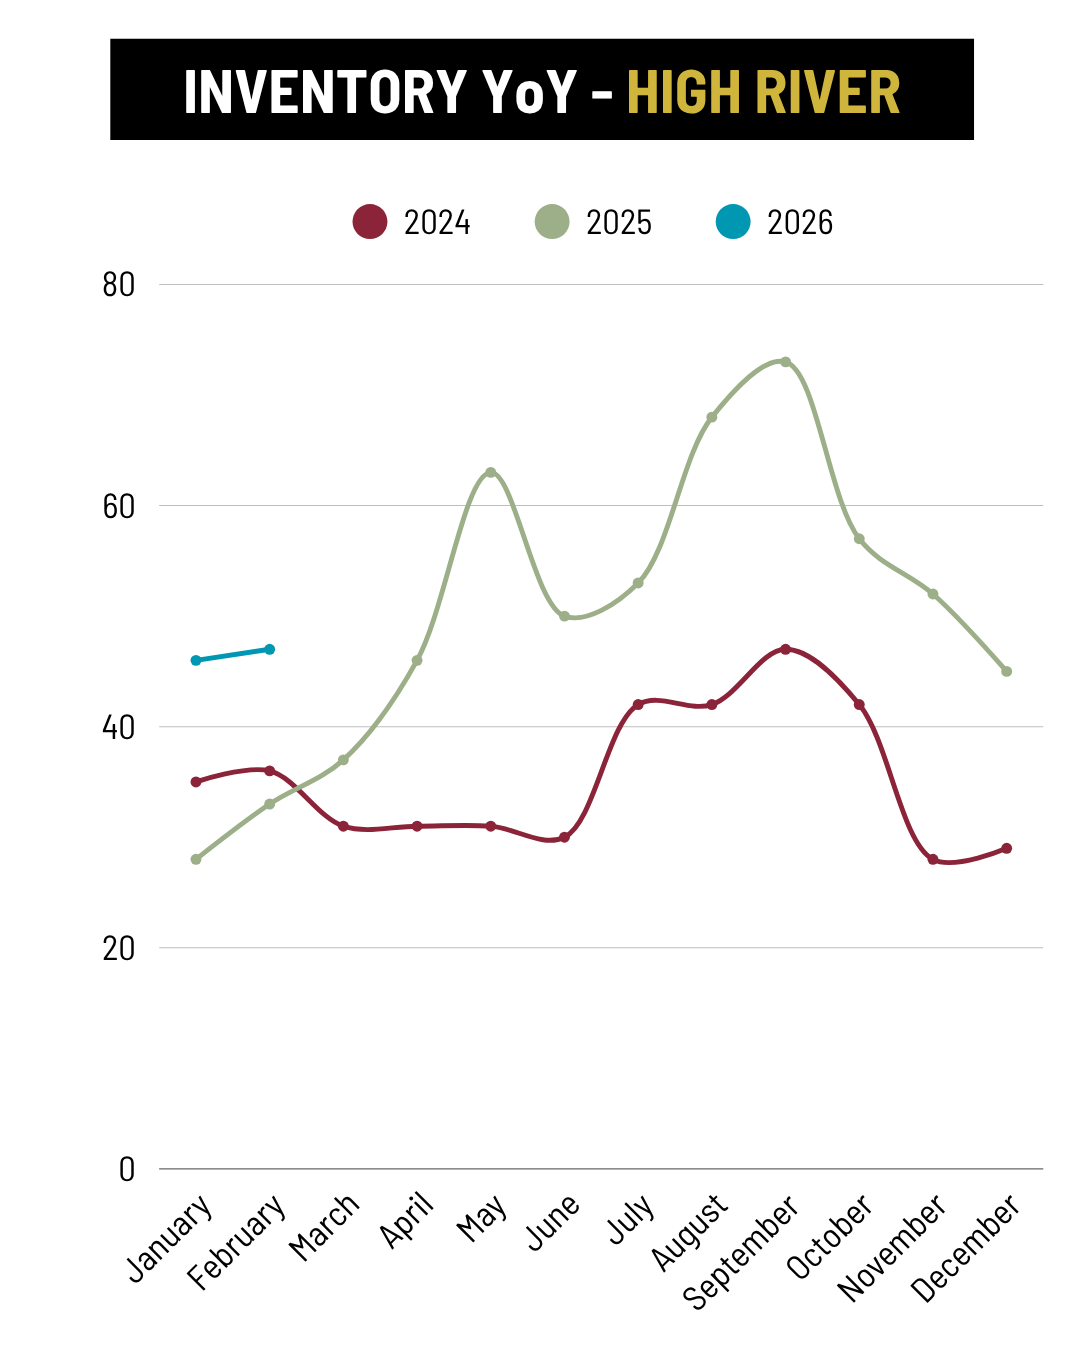
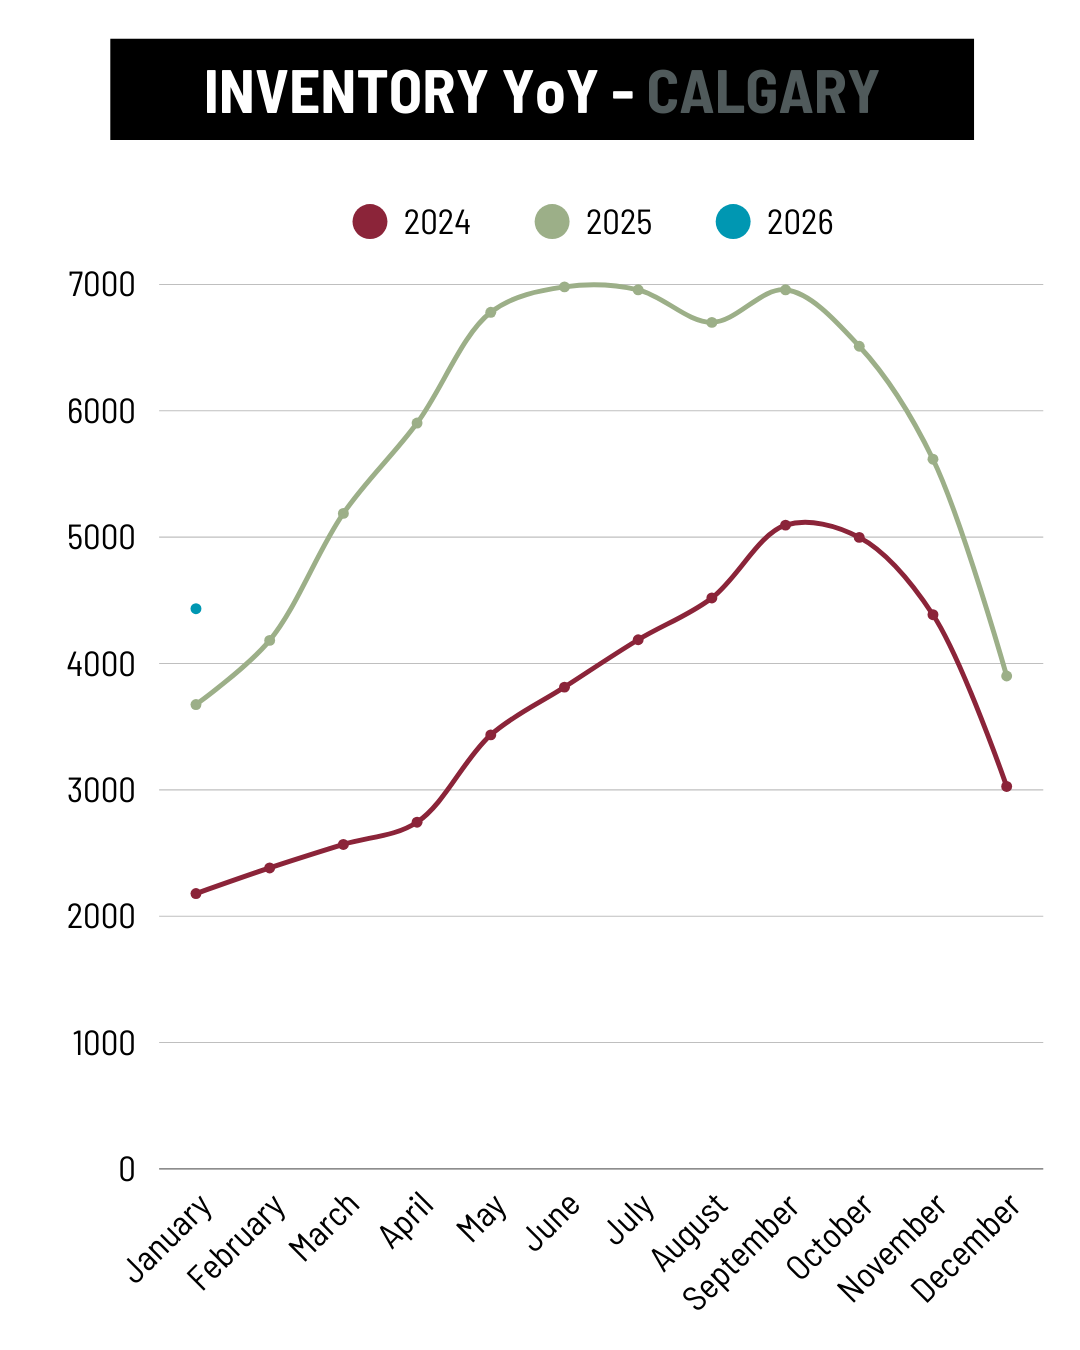
- Inventory remained essentially flat year-over-year (-2%)
As a result, the Sales-to-New-Listings Ratio improved from 56% to 73%, indicating stronger demand relative to supply.
This contrasts with:
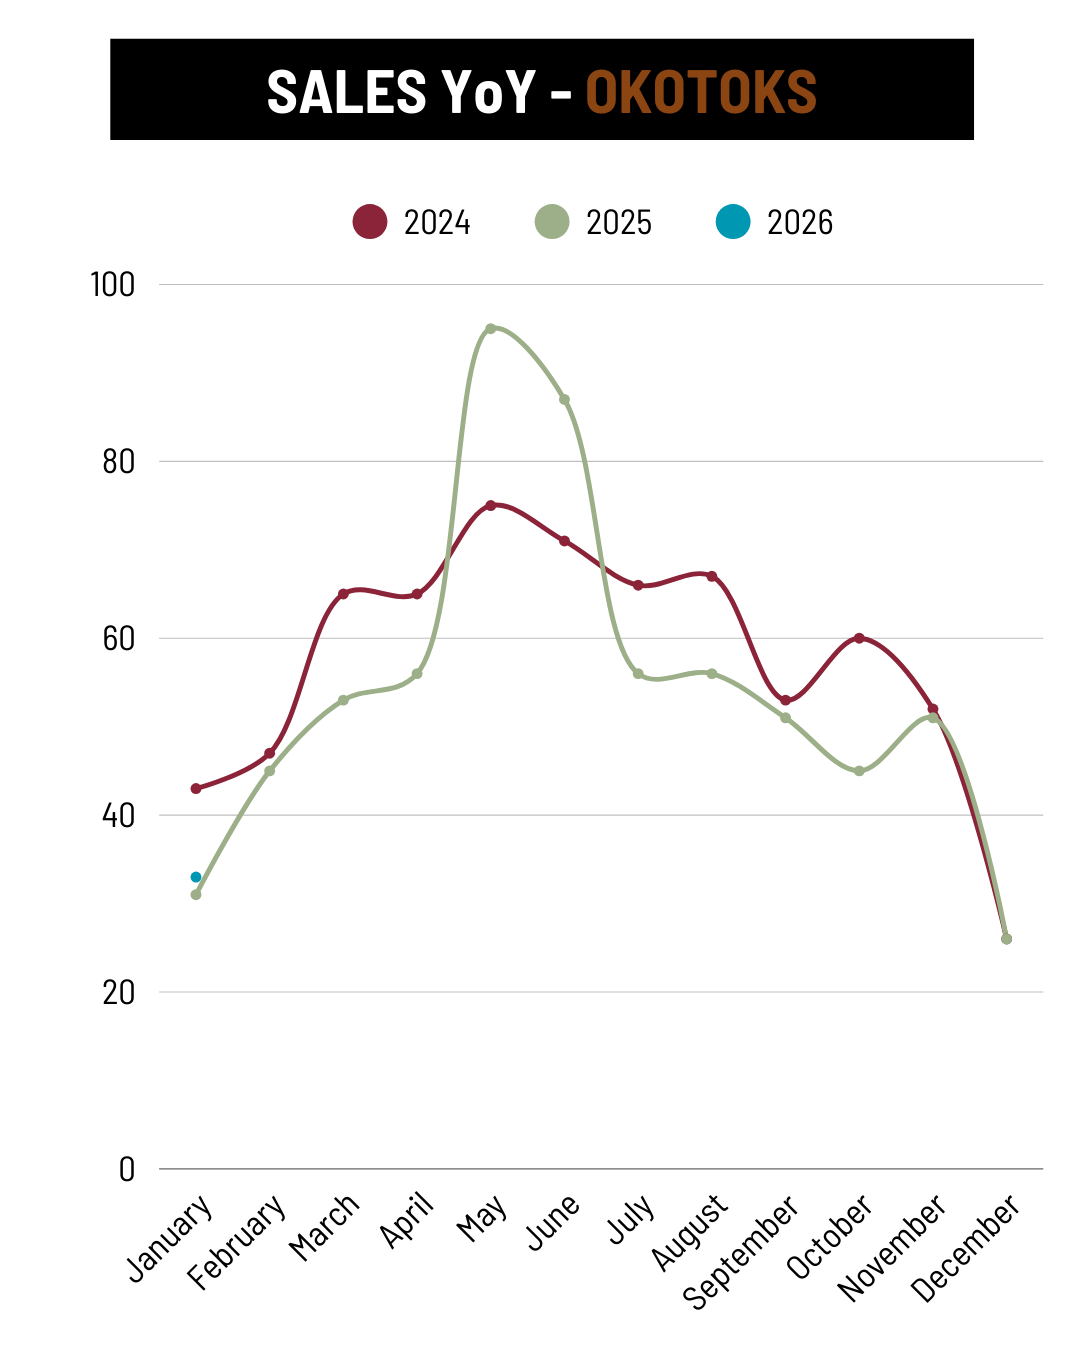
- Okotoks, where sales fell 24%
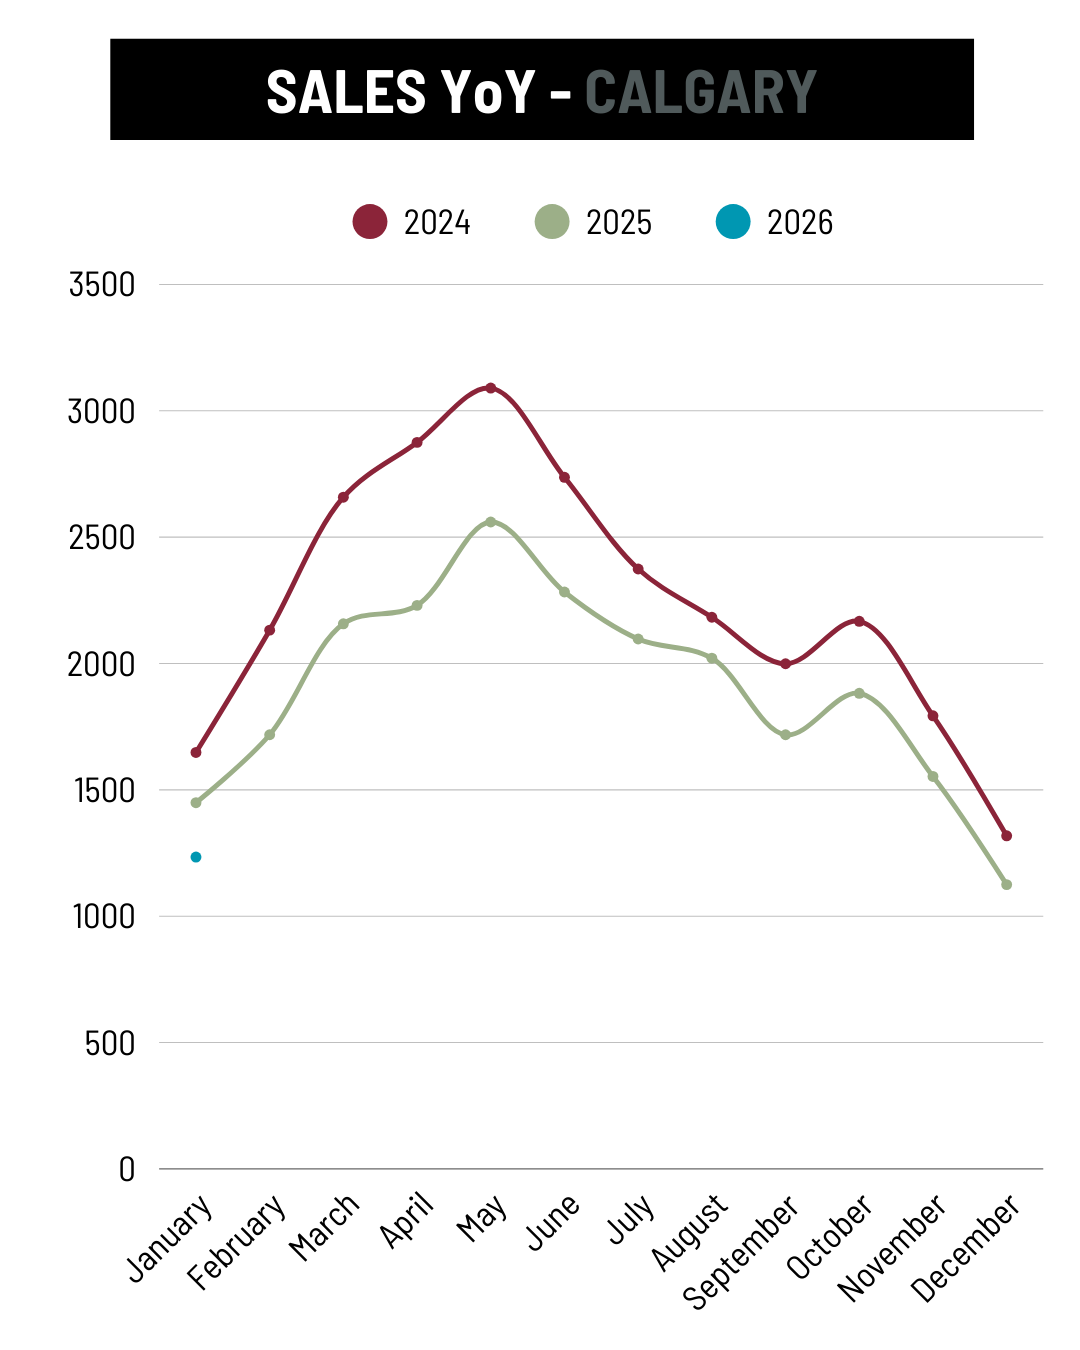
- Calgary, where sales fell 16%
Property Type Breakdown
Detached Homes:
Detached homes remain the foundation of the High River market.
- Median Price: $679,000 (+14% YoY)
- Sales: 20
- Inventory: 37
- Sales-to-New-Listings Ratio: 69%
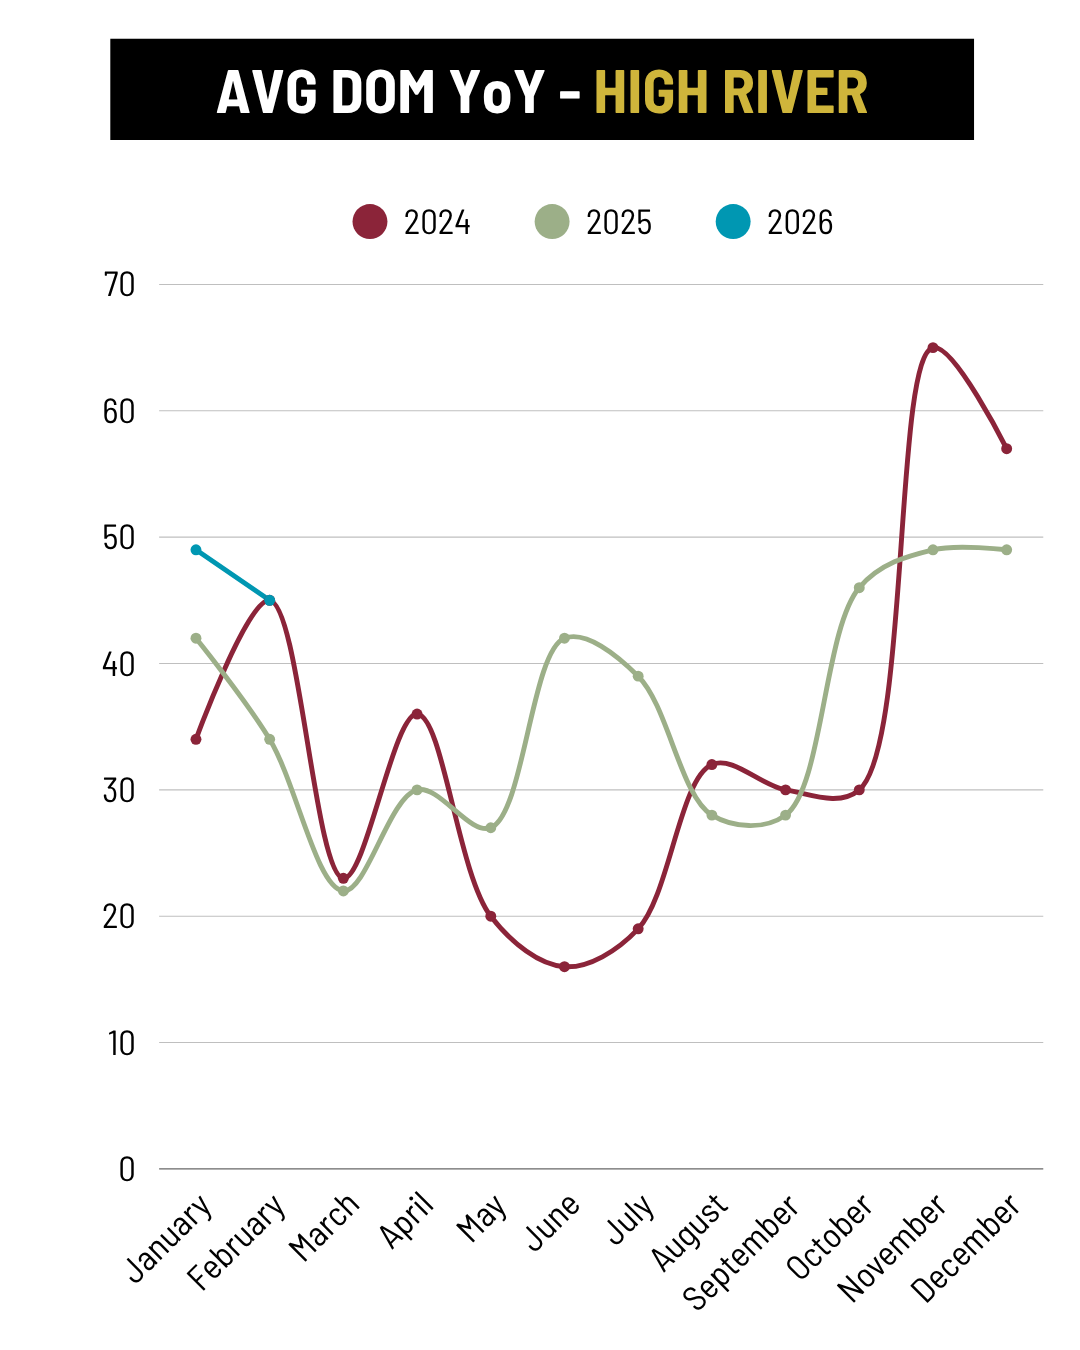
Prices remain strong despite homes taking longer to sell than last year.
Semi-Detached Homes
Semi-detached homes continue benefiting from affordability-focused buyers.
- Median Price: $538,750 (+24% YoY)
- Sales: unchanged from last year
- Inventory remains relatively low
This segment is performing particularly well as buyers seek alternatives to detached housing.
Townhomes
Townhomes were arguably the strongest-performing segment in May.
- Median Price: $385,000 (+28% YoY)
- Sales increased 200% year-over-year
- Inventory declined 39%
- Sales-to-New-Listings Ratio exceeded 100%
These numbers suggest exceptionally strong demand for entry-level ownership opportunities.
Apartments
Apartment activity remains limited due to small sample sizes.
The median price was lower than last year, but with only a handful of transactions, broad conclusions should be avoided.
Why We're Seeing These Trends
Several forces continue shaping the market:
Alberta's Population Growth
Alberta remains one of Canada's fastest-growing provinces. Interprovincial migration continues bringing new residents seeking lower housing costs and employment opportunities.
Affordability Matters
While borrowing costs have eased somewhat from their peak, affordability remains a major concern nationally.
This helps explain why:
- Townhomes are surging
- Semi-detached homes are appreciating strongly
- Buyers are carefully evaluating value
Market Balance Returns
Unlike the intense seller's markets of recent years, today's market offers:
- More negotiating room
- More informed buyers
- Better inventory levels
- Less competition
Yet demand remains healthy enough to support pricing.
What This Means for Buyers
1. More choice than in recent years
2. Strong demand for affordable housing types
3. Better negotiating conditions than during peak market years
What This Means for Sellers
1. Well-priced homes continue to sell
2. Detached homes remain highly sought after
3. Presentation and marketing are increasingly important
Bottom Line
The story of 2026 so far has been a transition from an overheated market toward a healthier balance. May may be the first sign that buyers are becoming more comfortable operating in this new environment.
High River continues to benefit from Alberta's strong economic fundamentals, population growth, and relative affordability. The strongest demand is increasingly concentrated in semi-detached and townhouse properties, highlighting how affordability is shaping today's housing market.

Why choose Seacrist Real Estate?
With over 40 years of combined experience and 1,300+ homes bought & sold for local families, we deliver strategic property solutions across High River, Cayley, Okotoks, Nanton, Diamond Valley, DeWinton, and area. As your Century 21 Foothills real estate advisors, we transform market complexity into clear, actionable insights so you can make the best real estate decisions.
Ready to make your strategic move?
Start with a complimentary consultation.
Market analysis for your specific property goals
Strategic timing guidance for optimal outcomes
Negotiation strategy session tailored to your situation
Investment potential assessment with trend forecasting
Why work with us?
🎯 Strategic negotiation expertise
📊 Data-driven local market intelligence
🏘️ Deep local market mastery
🤝 Professional partnership advantage
🌐 Century 21 global resources
⭐ 5 star reviews and 750+ satisfied local clients
Contact us today to get started.
Monthly Real Estate Market Update - April 2026 | High River, Okotoks, Calgary
By John Seacrist
Realtor, Seacrist Real Estate | C21 Foothills
May 7, 2026
The High River real estate market continued shifting toward a more balanced pace in April 2026, building on the trends we’ve seen developing throughout the first few months of the year. While prices remained resilient, rising inventory and slower sales activity are creating a calmer environment for buyers and sellers alike.
Compared to nearby Okotoks and Calgary, High River continues to hold up relatively well — particularly in detached homes — even as the broader Southern Alberta market adjusts to higher borrowing costs and changing buyer behavior.
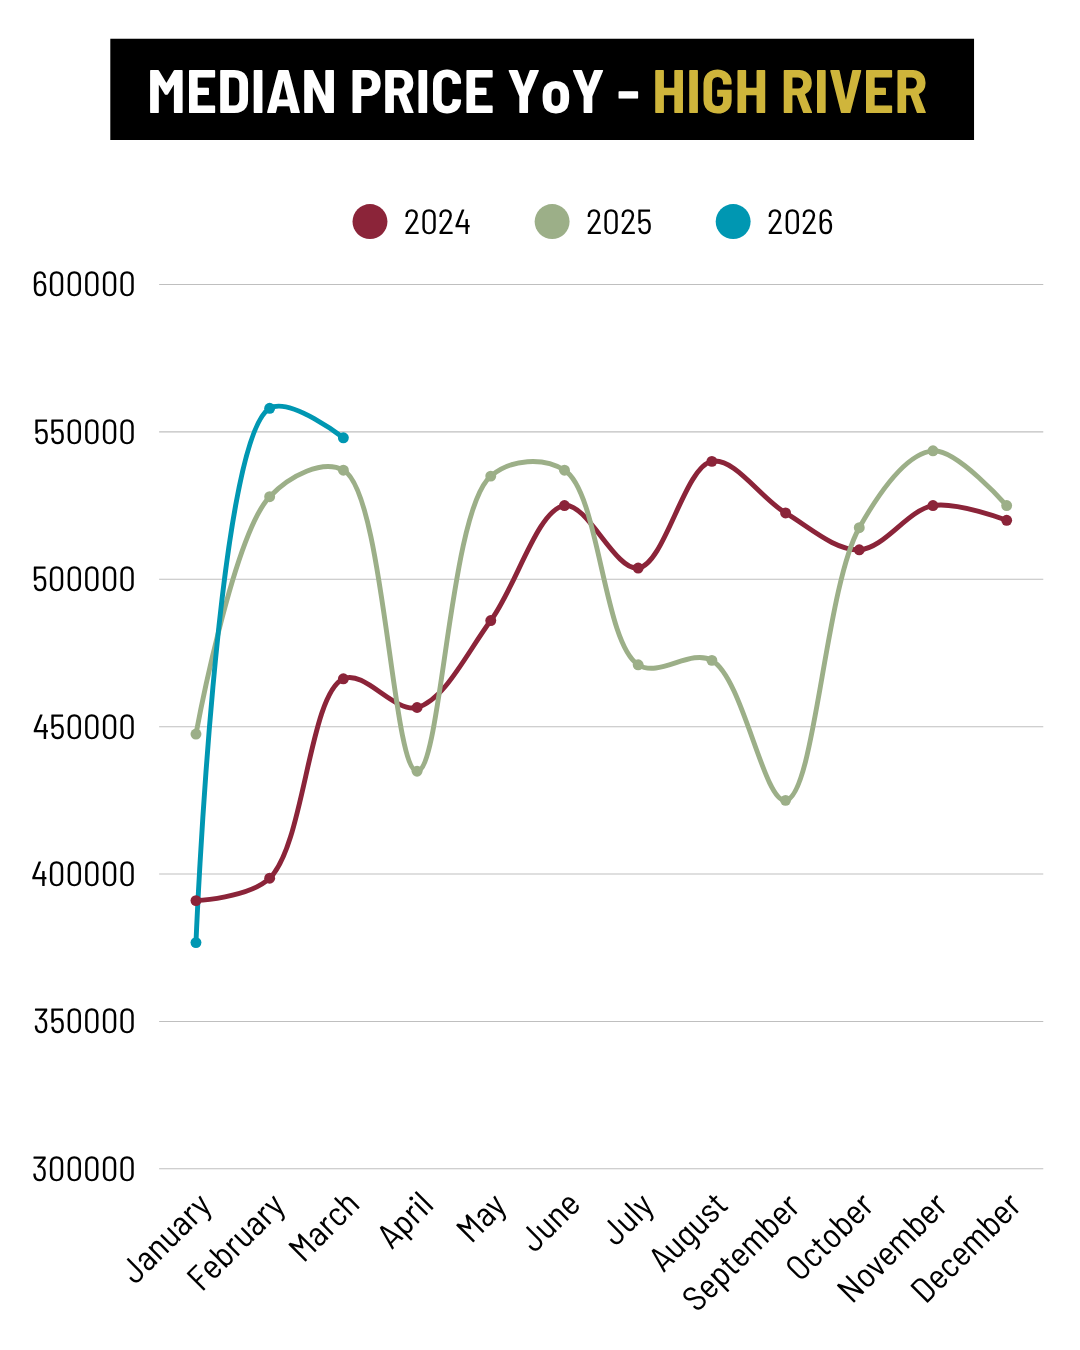
📊 Prices Continue to Hold
High River’s median price reached $520,000 in April, up 20% year-over-year. While monthly pricing can fluctuate depending on the types of homes sold, the broader trend still points to stable demand.
By comparison:
- Okotoks prices rose 14% year-over-year to $712,500
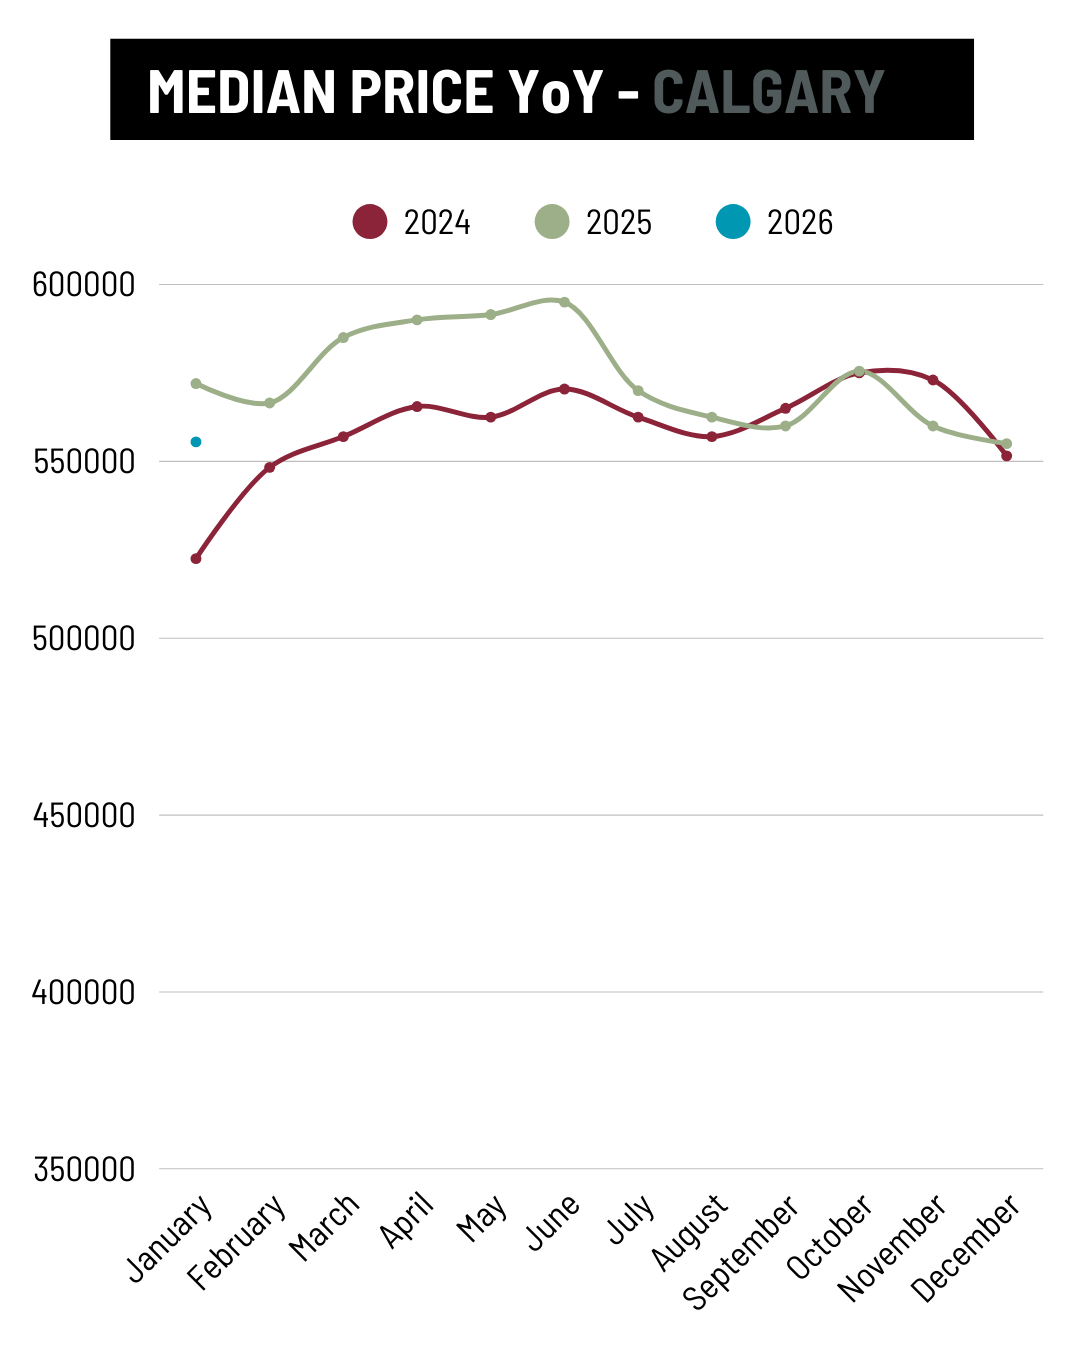
- Calgary prices were down slightly by 1% to $586,000
Despite softer sales activity, pricing across smaller communities remains relatively resilient thanks to continued migration into Alberta and demand for more affordable alternatives to major Canadian cities.
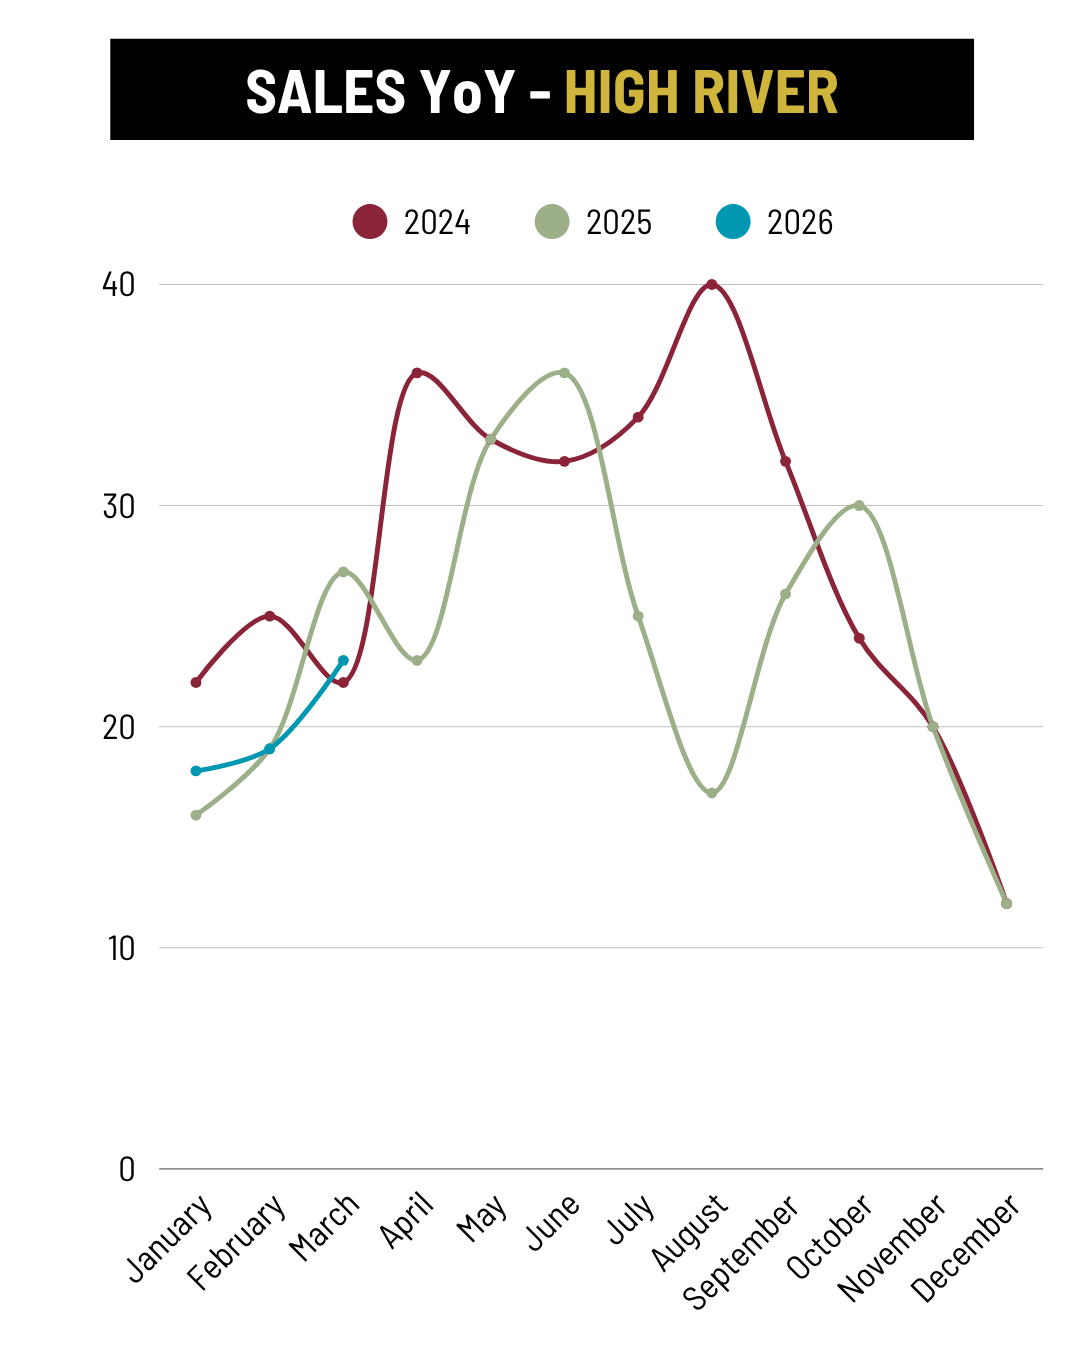
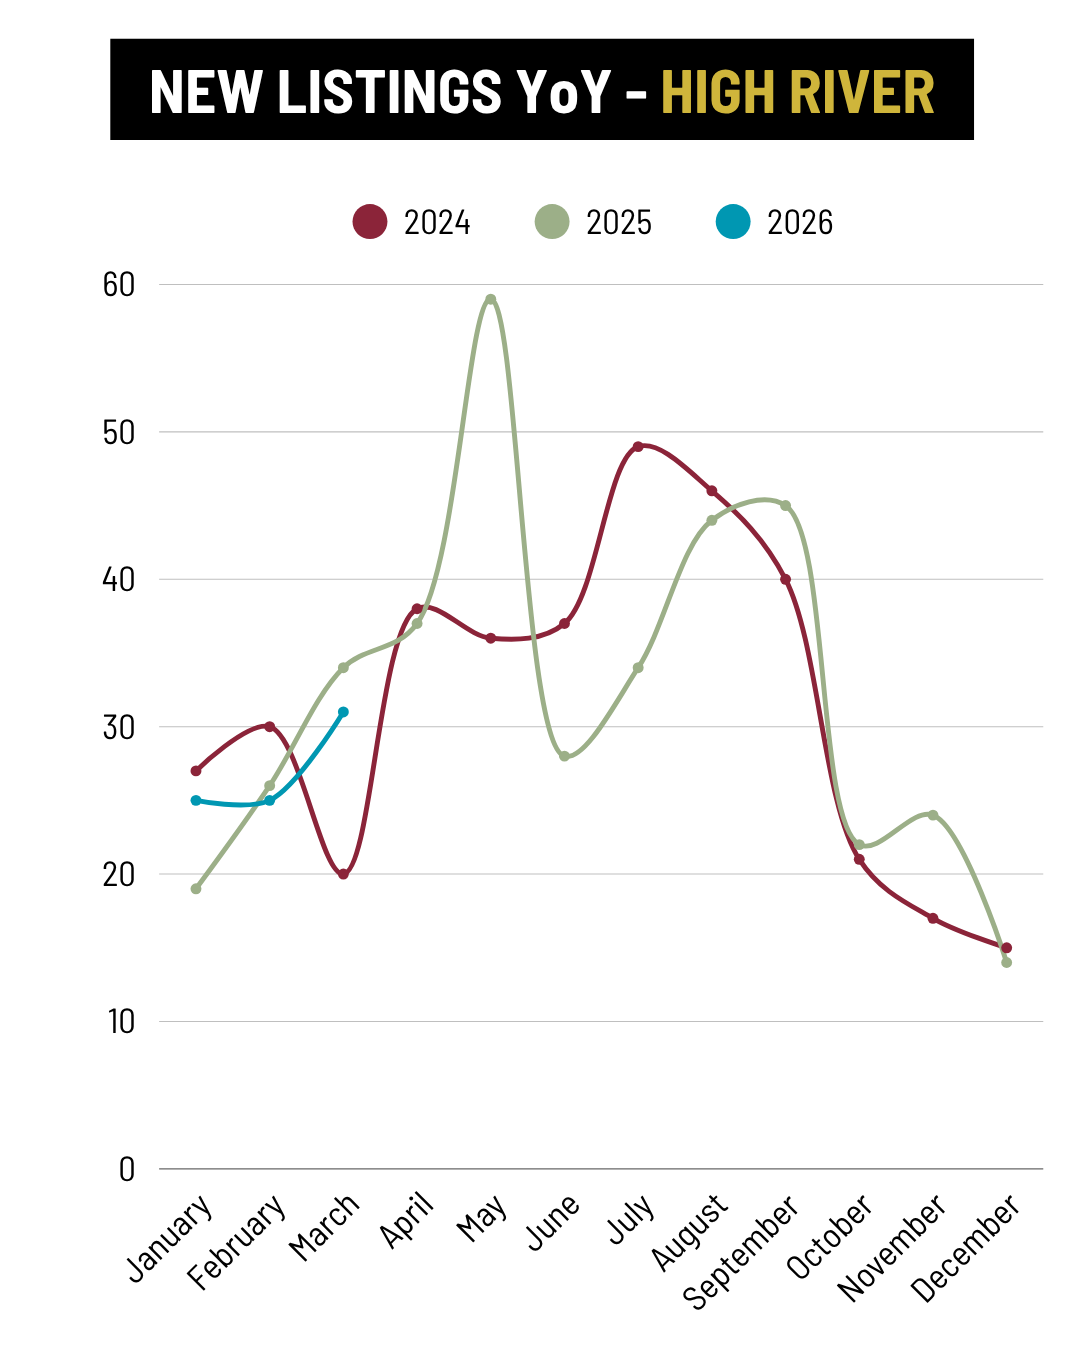
📉 Sales Slow While Inventory Builds
Sales in High River were down 13% year-over-year in April, while new listings rose 11% and inventory climbed 26%.
This means:
- Buyers have more options
- Homes face more competition
- Sellers need stronger pricing and marketing strategies
The Sales-to-New-Listings Ratio dropped from 62% to 49%, a clear sign the market is moving closer to balance after several years of intense seller-favouring conditions.
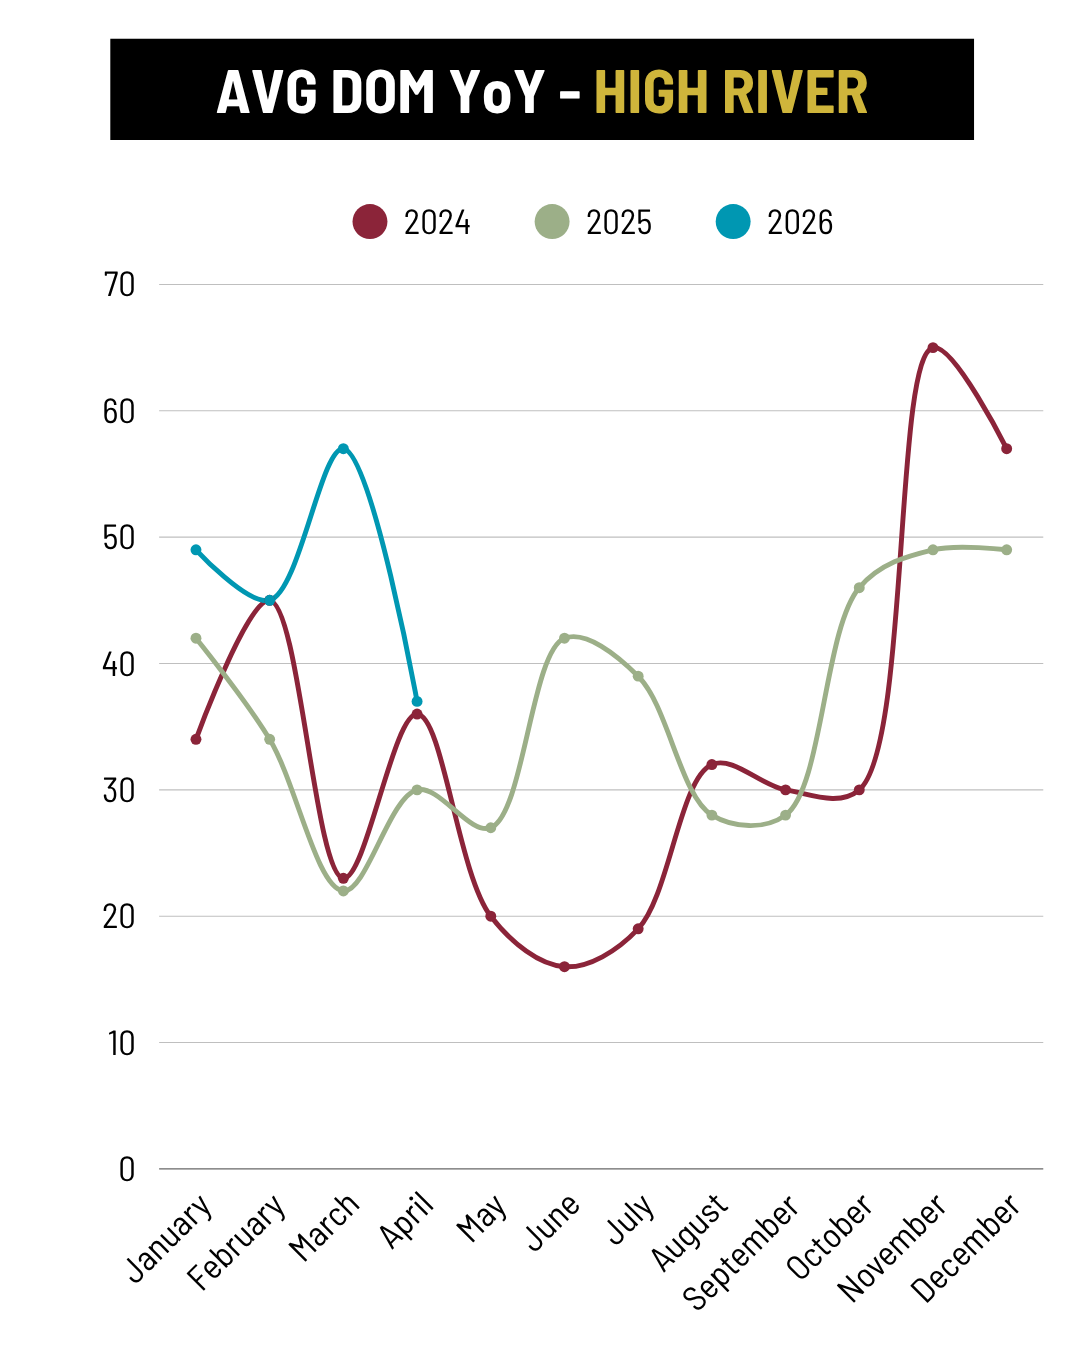
⏱ Days on Market: Improving but Still Elevated
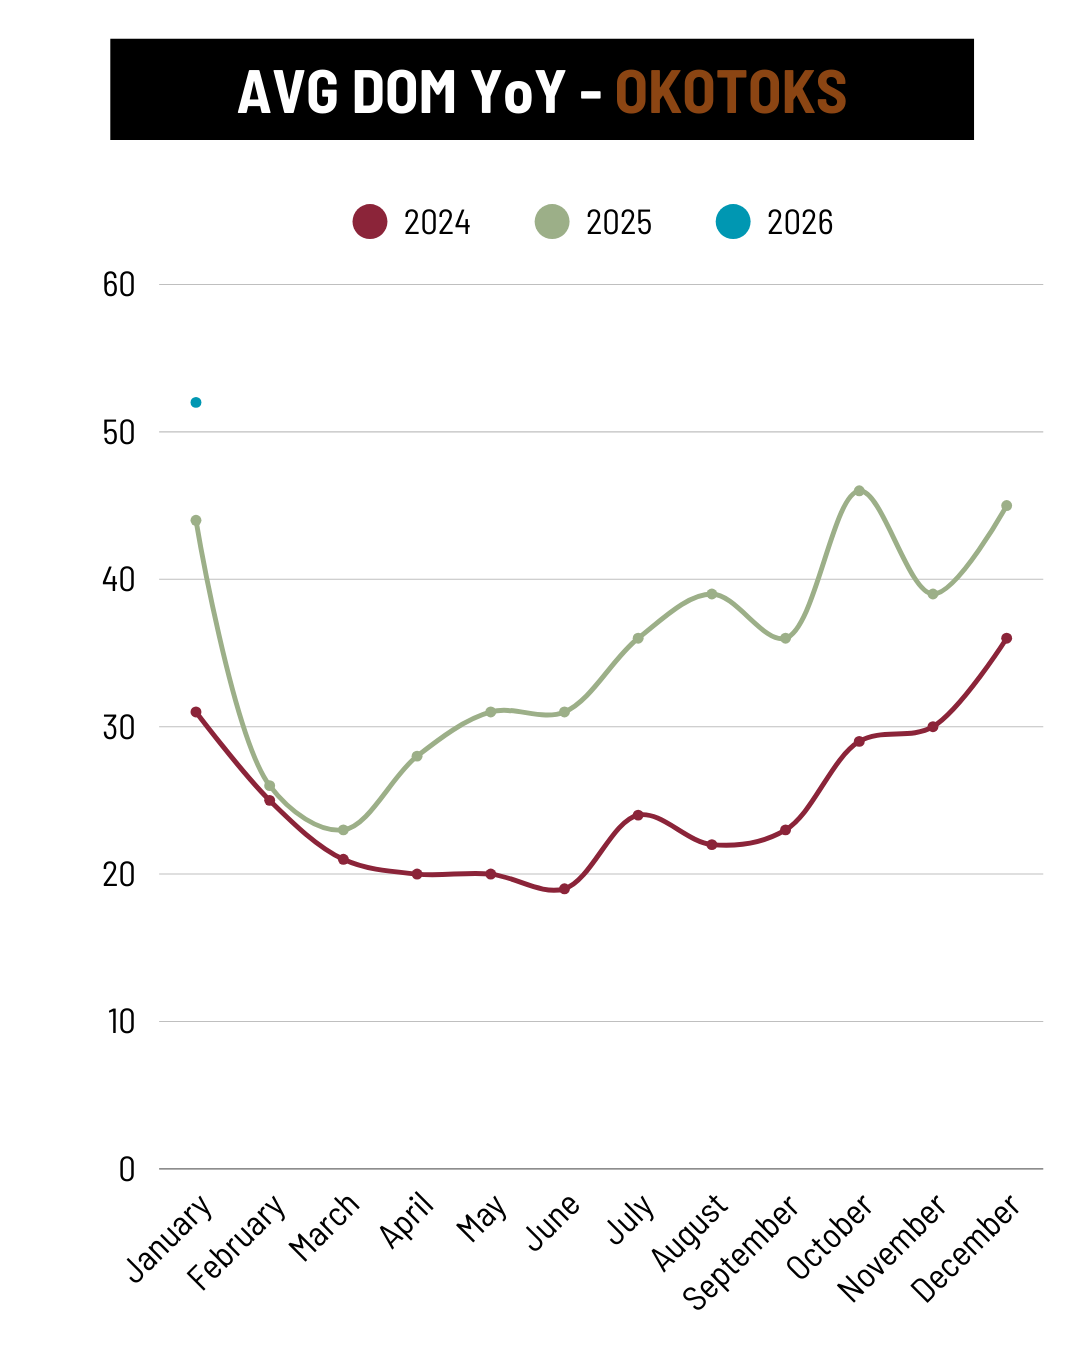
Homes in High River averaged 37 days on market, up 23% year-over-year, but improved from March’s slower pace.
Across the region:
- Okotoks: 26 days (-7% YoY)
- Calgary: 35 days (+25% YoY)
This suggests some momentum returning in spring, though still slower than peak years.
Property Type Breakdown: What’s Really Happening?
Detached Homes
Detached properties remain the most stable segment:
- Sales increased slightly (+8%)
- Median price held steady around $578K
- Inventory rose modestly (+9%)
Demand for detached homes remains strong, particularly among families relocating within Alberta.
Row & Townhomes
Townhomes saw the biggest market shift:
- Sales fell 63%
- Inventory doubled
- New listings jumped 50%
However, prices also rose sharply (+45%), suggesting affordability-focused buyers are still active but becoming more selective.
Semi-Detached Homes
Semi-detached homes experienced:
- Lower sales
- Higher inventory
- Longer selling timelines
Still, median pricing rose 19% year-over-year.
Broader Economic Context
Several larger economic forces continue influencing the market:
Alberta’s Economic Position
Alberta remains one of Canada’s stronger provincial economies, supported by:
- Energy sector stability
- Population growth
- Interprovincial migration
- Relative housing affordability
Many buyers continue relocating from more expensive provinces like Ontario and British Columbia.
Interest Rates & Affordability
Higher borrowing costs continue to reduce urgency among buyers. Even with stable employment, affordability remains a major factor influencing purchasing decisions.
Market Psychology Is Changing
After years of bidding wars and rapid appreciation, buyers are now:
- Taking more time
- Comparing options carefully
- Negotiating more aggressively
This is creating a healthier, more sustainable pace overall.
What This Means Going Forward
High River’s market is no longer the extremely tight seller’s market we saw in previous years — but demand remains steady, especially for detached homes.
For buyers:
More inventory means more negotiating power and less pressure.
For sellers:
Proper pricing, presentation, and strategy matter more than ever.
Overall, the market is transitioning toward a more balanced and sustainable environment as Alberta’s economy continues to outperform much of Canada while national affordability challenges reshape buyer behavior.
YoY Market Statistic Trends - High River
Why choose Seacrist Real Estate?
With over 40 years of combined experience and 1,300+ homes bought & sold for local families, we deliver strategic property solutions across High River, Cayley, Okotoks, Nanton, Diamond Valley, DeWinton, and area. As your Century 21 Foothills real estate advisors, we transform market complexity into clear, actionable insights so you can make the best real estate decisions.
Ready to make your strategic move?
Start with a complimentary consultation.
Market analysis for your specific property goals
Strategic timing guidance for optimal outcomes
Negotiation strategy session tailored to your situation
Investment potential assessment with trend forecasting
Why work with us?
🎯 Strategic negotiation expertise
📊 Data-driven local market intelligence
🏘️ Deep local market mastery
🤝 Professional partnership advantage
🌐 Century 21 global resources
⭐ 5 star reviews and 750+ satisfied local clients
Contact us today to get started.
Monthly Real Estate Market Update - March 2026 | High River, Okotoks, Calgary
By John Seacrist
Realtor, Seacrist Real Estate | C21 Foothills
April 16, 2026
The High River real estate market is continuing its transition into a more balanced spring market. Looking at February and March together, we’re seeing steady pricing, rising inventory, and a slower pace of sales — trends that are consistent across Okotoks and Calgary.
📊 Prices: Holding Steady
After a strong rebound in February, High River’s median price came in at $548,000 in March, up 2% year-over-year.
This stability suggests that while the market has cooled from peak conditions, overall home values are holding.
By comparison:
- Okotoks: $651,000 (-6% YoY)
- Calgary: $575,500 (-2% YoY)
High River continues to show relatively stable pricing compared to surrounding markets.
📉 Sales: A Softer Spring Start
Sales in High River were down 15% year-over-year in March, reflecting a slower pace of activity.
Across the region:
- Okotoks sales were slightly down (-2% YoY)
- Calgary saw a larger drop (-13% YoY)
This suggests buyer activity is still present, but more measured than in previous years.
📦 Inventory: More Choice for Buyers
Inventory remains significantly higher than last year:
- High River: +32% YoY
- Okotoks: +21% YoY
- Calgary: +5% YoY
More available homes means buyers have options — and that reduces the urgency that defined the market in recent years.
The sales-to-new-listings ratio in High River dipped slightly (79% → 74%), reinforcing the shift toward balance.
⏱ Days on Market: A Noticeable Slowdown
Homes are taking longer to sell:
- High River: 57 days (+159% YoY)
- Okotoks: 37 days (+61% YoY)
- Calgary: 35 days (+21% YoY)
This is one of the clearest signs of a changing market, as buyers take more time to evaluate their options.
What’s Driving These Changes?
Interest Rates & Affordability
Higher borrowing costs continue to impact affordability, causing buyers to be more cautious and selective.
Alberta’s Economic Strength
Alberta remains economically strong within Canada, supported by:
- Job growth
- Energy sector stability
- Strong interprovincial migration
This helps maintain underlying housing demand.
Supply Catching Up
After years of low inventory, more homeowners are listing, increasing supply and balancing the market.
Changing Buyer Behaviour
Buyers are no longer rushing — they’re comparing options, negotiating, and taking more time.
What This Means for You
Buyers
- More selection
- Less competition
- More negotiating power
Sellers
- Prices are holding, but strategy matters
- Expect longer timelines
- Proper pricing is critical
The Bottom Line
High River’s market is not slowing down — it’s stabilizing.
Compared to Okotoks and Calgary, pricing remains relatively steady, but increased inventory and slower sales are creating a more balanced and sustainable market in spring 2026.
YoY Market Statistic Trends - High River
Why choose Seacrist Real Estate?
With over 40 years of combined experience and 1,300+ homes bought & sold for local families, we deliver strategic property solutions across High River, Cayley, Okotoks, Nanton, Diamond Valley, DeWinton, and area. As your Century 21 Foothills real estate advisors, we transform market complexity into clear, actionable insights so you can make the best real estate decisions.
Ready to make your strategic move?
Start with a complimentary consultation.
Market analysis for your specific property goals
Strategic timing guidance for optimal outcomes
Negotiation strategy session tailored to your situation
Investment potential assessment with trend forecasting
Why work with us?
🎯 Strategic negotiation expertise
📊 Data-driven local market intelligence
🏘️ Deep local market mastery
🤝 Professional partnership advantage
🌐 Century 21 global resources
⭐ 5 star reviews and 750+ satisfied local clients
Contact us today to get started.
What’s the Best Acreage Area Near Calgary for You?
High River, Okotoks, Diamond Valley, Nanton, De Winton, or Calgary – find out what acreage living offers around each area.
By John Seacrist
Realtor, Seacrist Real Estate | C21 Foothills
April 1, 2026
Looking for acreage living near Calgary but not sure which community fits your lifestyle? Acreages aren’t just about extra land—they offer privacy, outdoor space, hobby farms, and a country lifestyle that changes depending on the town or area you choose. From scenic rural retreats to family-friendly plots near the city, Southern Alberta has something for every buyer.
Here’s a strategic guide to what acreage living offers around High River, Okotoks, Diamond Valley, Nanton, De Winton, and Calgary, including lot sizes, lifestyle benefits, and local market trends.
1. Acreages Around High River – Family-Friendly Country Life
Lot sizes: Typically 1–5 acres
What it offers:
- Room for children, pets, or small-scale farming
- Strong community amenities: parks, schools, and recreation
- Quick access to Calgary (~30 min), making it commuter-friendly
Strategic insight: Acreages near High River see steady demand and resale potential due to proximity to schools, services, and Calgary—ideal for families seeking both lifestyle and long-term value.
Best for: Families or professionals wanting country space with city access.
2. Acreages Around Okotoks – Modern Rural Living
Lot sizes: Typically 1–3 acres
What it offers:
- Smaller but manageable acreages with modern home options
- Trails, parks, and recreational facilities within walking distance
- Strong town infrastructure, shopping, and events
Strategic insight: Rapid population growth in Okotoks (~10% over 5 years) has increased demand for nearby acreages, making these good investments for lifestyle and appreciation.
Best for: Buyers seeking amenities, outdoor recreation, and a strong community feel while still enjoying acreage space.
3. Acreages Around Diamond Valley (Black Diamond & Turner Valley) – Scenic & Recreational
Lot sizes: Typically 2–10 acres
What it offers:
- Stunning mountain and river views
- Access to recreational activities: hiking, horseback riding, and skiing
- Secluded and private properties
Strategic insight: Limited supply of larger lots drives competition among buyers. Premium value is tied to privacy and scenic views, rather than proximity to the city.
Best for: Buyers craving nature, large lots, and an outdoor-focused lifestyle.
4. Acreages Around Nanton – Space and Peace
Lot sizes: Typically 2–10 acres
What it offers:
- Wide-open spaces for hobby farms, gardens, or equestrian pursuits
- Peaceful rural lifestyle with very low population density
- Local small-town amenities without city bustle
Strategic insight: Acreages around Nanton are more affordable per acre than other areas south of Calgary, making it ideal for buyers seeking maximum land for their budget.
Best for: Buyers who prioritize space, privacy, and a quiet, country lifestyle over commuting convenience.
5. Acreages Around De Winton – Country Living Close to Calgary
Lot sizes: Typically 1–5 acres
What it offers:
- Rural charm with short commute times (~20–30 min)
- Private lots suitable for small farms, gardens, or outdoor hobbies
- Quiet escape from city noise without sacrificing convenience
Strategic insight: Acreages near De Winton offer a balance of privacy and city access, making them popular with professionals and small families who want country lifestyle without long drives.
Best for: Commuters or small families seeking a private rural property near Calgary.
6. Acreages Around Calgary – Semi-Rural City Living
Lot sizes: Typically 0.5–2 acres
What it offers:
- Privacy and space without leaving city limits
- Access to city amenities: schools, healthcare, and shopping
- Opportunity for custom homes, hobby gardens, and small-scale livestock
Strategic insight: Calgary acreages are smaller but easier to finance and resell quickly. Perfect for buyers who want urban convenience with some country lifestyle.
Best for: Buyers who want space, privacy, and rural-style living without leaving the city.
Key Considerations When Choosing an Acreage by Area
| Nanton | 2–10 acres | 50+ min | Affordable | Maximum land, privacy, hobby farms |
| High River | 1–5 acres | 30 min | Steady appreciation | Family-friendly, amenities, quick commute |
| Okotoks | 1–3 acres | 30–40 min | Higher than High River | Modern amenities, community, recreation |
| Diamond Valley | 2–10 acres | 45+ min | Moderate | Scenic views, outdoor lifestyle, seclusion |
| De Winton | 1–5 acres | 20–30 min | Affordable | Private lots, rural escape near city |
| Calgary | 0.5–2 acres | N/A | Premium | Semi-rural living, city services, convenience |
❓ Frequently Asked Questions – Acreage Living in Southern Alberta
Why choose Seacrist Real Estate?
With over 40 years of combined experience and 1,300+ homes bought & sold for local families, we deliver strategic property solutions across High River, Cayley, Okotoks, Nanton, Diamond Valley, DeWinton, and area. As your Century 21 Foothills real estate advisors, we transform market complexity into clear, actionable insights so you can make the best real estate decisions.
Ready to make your strategic move?
Start with a complimentary consultation.
Market analysis for your specific property goals
Strategic timing guidance for optimal outcomes
Negotiation strategy session tailored to your situation
Investment potential assessment with trend forecasting
Why work with us?
🎯 Strategic negotiation expertise
📊 Data-driven local market intelligence
🏘️ Deep local market mastery
🤝 Professional partnership advantage
🌐 Century 21 global resources
⭐ 5 star reviews and 750+ satisfied local clients
Contact us today to get started.
Monthly Real Estate Market Update - February 2026 | High River, Okotoks, Calgary
By John Seacrist
Realtor, Seacrist Real Estate | C21 Foothills
March 23, 2026
The High River real estate market is showing early signs of stabilization in 2026 after a mixed start to the year. Looking at January and February together gives a clearer picture of where things are heading — and how High River compares to Okotoks and Calgary.
📊 Prices: A Rebound After January’s Dip
January saw a sharp drop in the median price to $376,750 (-16% YoY), but February quickly rebounded to $558,000 (+5% YoY).
This kind of swing is often tied to the types of homes selling in a given month rather than a true drop and recovery in property values. February’s rebound suggests that overall demand — particularly for detached homes — remains strong.
By comparison:
Okotoks: $595,750 (-5% YoY)
Calgary: $565,000 (flat YoY)
High River is showing stronger price resilience than surrounding markets.
📉 Sales: Steady in High River, Softer Elsewhere
High River sales remain stable:
January: +13% YoY
February: +6% YoY
Meanwhile:
Okotoks saw a 20% drop in February sales
Calgary continues to trend down (-11% YoY)
This suggests High River is maintaining buyer interest better than larger markets.
📦 Inventory: The Biggest Shift
Inventory remains significantly higher than last year:
High River: +38% YoY
Okotoks: +38% YoY
Calgary: +16% YoY
More supply means buyers have options — and that naturally reduces urgency and competition.
The sales-to-new-listings ratio in High River improved from January to February (72% → 76%), showing demand is keeping pace with new supply better than in nearby markets.
⏱ Days on Market: A Slower Pace
Homes are taking longer to sell across the region:
High River: 45 days (+55% YoY)
Okotoks: 41 days (+58% YoY)
Calgary: 41 days (+28% YoY)
This reflects a more balanced environment where buyers are taking time to evaluate options.
What’s Driving These Changes?
Interest Rates & Affordability
Higher borrowing costs continue to impact how much buyers can afford, leading to more cautious decision-making.
Alberta’s Economic Strength
Alberta remains one of the strongest provincial economies in Canada, supported by:
- Job growth
- Energy sector stability
- Strong interprovincial migration
This continues to support long-term housing demand, especially in more affordable communities like High River.
Population Growth & Lifestyle Shifts
More people are moving to smaller communities for affordability and lifestyle — a trend that benefits High River.
Market Normalization
After years of tight supply and rapid price growth, the market is naturally shifting back toward balance.
What This Means for You
Buyers
- More inventory = more choice
- Less competition
- Better negotiation opportunities
Sellers
- Prices are still holding, especially for desirable homes
- Strategic pricing and presentation are key
- Expect slightly longer timelines
The Bottom Line
High River is not slowing down — it’s stabilizing.
Compared to Okotoks and Calgary, the market is showing stronger price performance and steadier sales, even as inventory rises. The shift toward balance is creating a healthier environment for both buyers and sellers heading into the spring market.
YoY Market Statistic Trends - High River
Why choose Seacrist Real Estate?
With over 40 years of combined experience and 1,300+ homes bought & sold for local families, we deliver strategic property solutions across High River, Cayley, Okotoks, Nanton, Diamond Valley, DeWinton, and area. As your Century 21 Foothills real estate advisors, we transform market complexity into clear, actionable insights so you can make the best real estate decisions.
Ready to make your strategic move?
Start with a complimentary consultation.
Market analysis for your specific property goals
Strategic timing guidance for optimal outcomes
Negotiation strategy session tailored to your situation
Investment potential assessment with trend forecasting
Why work with us?
🎯 Strategic negotiation expertise
📊 Data-driven local market intelligence
🏘️ Deep local market mastery
🤝 Professional partnership advantage
🌐 Century 21 global resources
⭐ 5 star reviews and 750+ satisfied local clients
Contact us today to get started.
Buying an Acreage in Foothills County: What You Need to Know
By John Seacrist
Realtor, Seacrist Real Estate | C21 Foothills
February 27, 2026
Buying an acreage in Foothills County is very different from buying a home in town. While rural properties offer space, privacy, and incredible views, they also come with additional responsibilities and considerations.
If you're exploring acreages near Okotoks, High River, Diamond Valley, Nanton, or surrounding areas, here’s what to understand before making an offer.
1. Water Systems: Wells vs Cisterns
Most rural properties in Foothills County do not use municipal water. Instead, they rely on:
-
Drilled wells
-
Cistern systems (water hauled and stored onsite)
Before buying, we'll help you confirm:
-
Type of water system
-
Well depth and production rate (if applicable)
-
Water quality testing results
-
Age and condition of equipment
Water systems vary widely from property to property, so this is one of the most important due-diligence steps.
2. Septic Systems and Wastewater
Acreage homes typically use:
-
Septic tanks with fields
-
Pump-out systems
-
Treatment systems (in some cases)
Important considerations:
-
Age of the system
-
Maintenance history
-
Location of septic field
-
Any required inspections before purchase
Septic replacement can be expensive, so understanding system condition is critical.
3. Zoning and Permitted Uses
Foothills County zoning determines what you can and cannot do with a property. Depending on the zoning classification, this may affect:
-
Keeping livestock
-
Building additional structures
-
Operating home-based businesses
-
Subdividing land
-
Agricultural uses
Before buying, confirm the property’s zoning and how it aligns with your plans. Not all acreages allow the same uses, even if they appear similar.
4. Outbuildings, Shops, and Permits
Many buyers look for:
-
Detached shops
-
Barns
-
Quonsets
-
Equipment storage
-
Guest suites
It’s important to verify:
-
Whether structures were permitted
-
Electrical service adequacy
-
Insulation/heating capability
-
Property tax implications
Unpermitted structures can create financing or resale challenges later.
5. Road Access and Maintenance
Unlike town homes, rural properties may involve:
-
Gravel roads
-
Shared driveways
-
Longer access routes
-
Snow clearing responsibilities
In winter, road conditions matter. Check:
-
Is access municipal or privately maintained?
-
Are there shared road agreements?
-
How steep is the driveway?
These practical details impact daily life more than most buyers initially expect.
6. Utility Services
In addition to water and septic, rural properties may use:
-
Propane heating
-
Private gas lines
-
Septic pump systems
-
Acreage electrical service
Utility costs can vary depending on home size, age, and servicing setup. Understanding annual operating costs is part of evaluating affordability.
7. Insurance and Financing Considerations
Some rural properties:
-
Require specialized insurance
-
May need additional septic or well testing
-
Could have stricter lender conditions
Working with professionals familiar with rural transactions helps avoid unexpected delays.
8. Ongoing Maintenance Expectations
Acreage ownership often involves:
-
Well and septic monitoring
-
Driveway grading
-
Fence repairs
-
Larger lawn/land maintenance
-
Outbuilding upkeep
For many buyers, the tradeoff is worthwhile — but it’s important to be realistic about the commitment.
9. Commuting from Foothills County
Foothills County covers a large area, so commute times vary by location. Typical driving ranges may include:
-
Okotoks: ~10–30 minutes
-
High River: ~10–35 minutes
-
South Calgary: ~30–55 minutes
-
Downtown Calgary: ~40–70 minutes
Exact times depend on the property’s location within the county.
10. Is Buying an Acreage Worth It?
Acreage living can be extremely rewarding for buyers who value:
-
Privacy
-
Outdoor lifestyle
-
Scenic surroundings
-
Space for hobbies or animals
-
Long-term land ownership
But it requires:
-
More due diligence
-
More maintenance awareness
-
A clear understanding of servicing and zoning
The key is buying with the right expectations.
Final Thoughts
Buying an acreage in Foothills County isn’t just purchasing a home — it’s choosing a lifestyle.
Understanding wells, septic systems, zoning rules, outbuildings, access roads, and maintenance expectations will help you make a confident and informed decision.
If you’re considering an acreage near Okotoks, High River, Diamond Valley, or Nanton, having local guidance can make the process significantly smoother.
Looking somewhere specific?
See more listings by community:
Why choose Seacrist Real Estate?
With over 40 years of combined experience and 1,300+ homes bought & sold for local families, we deliver strategic property solutions across High River, Cayley, Okotoks, Nanton, Diamond Valley, DeWinton, and area. As your Century 21 Foothills real estate advisors, we transform market complexity into clear, actionable insights so you can make the best real estate decisions.
Ready to make your strategic move?
Start with a complimentary consultation.
Market analysis for your specific property goals
Strategic timing guidance for optimal outcomes
Negotiation strategy session tailored to your situation
Investment potential assessment with trend forecasting
Why work with us?
🎯 Strategic negotiation expertise
📊 Data-driven local market intelligence
🏘️ Deep local market mastery
🤝 Professional partnership advantage
🌐 Century 21 global resources
⭐ 5 star reviews and 750+ satisfied local clients
Contact us today to get started.
Monthly Real Estate Market Update - January 2026 | High River, Okotoks, Calgary
By John Seacrist
Realtor, Seacrist Real Estate | C21 Foothills
February 22, 2026
The High River real estate market is entering 2026 with more balance — and more opportunity — than we’ve seen in the past two years.
📉 Prices
In December 2025, the median home price in High River held steady at $525,000 (+1% YoY). However, January 2026 showed a median price of $376,750, down 16% year-over-year.
That sharp drop may look dramatic, but it’s important to understand that monthly median prices can shift significantly depending on what type of homes sell. A higher percentage of townhomes or lower-priced detached homes trading in January can pull the median down without signaling a collapse in overall property values.
By comparison:
-
Okotoks median price: $610,000 (-4% YoY)
-
Calgary median price: $555,500 (-3% YoY)
Across the region, pricing has cooled slightly.
📊 Sales Activity
Despite softer prices, High River sales were actually up 13% year-over-year in January. Buyers are still active.
Meanwhile:
-
Okotoks sales rose 6% YoY
-
Calgary sales declined 15% YoY
High River appears comparatively resilient in activity levels.
📦 Inventory & Supply
This is where we see the biggest shift.
Inventory in High River is up 64% year-over-year. More homes are available, which gives buyers options and reduces the urgency we saw during peak seller-market conditions.
Inventory is also up significantly in:
-
Okotoks (+16% YoY)
-
Calgary (+21% YoY)
The Sales-to-New-Listings Ratio in High River declined from 84% to 72%, indicating movement toward a more balanced market.
⏱ Days on Market
Homes are taking longer to sell:
-
High River: 49 days (+17% YoY)
-
Okotoks: 52 days (+18% YoY)
-
Calgary: 53 days (+33% YoY)
This suggests buyers are taking more time and negotiating more carefully.
What’s Driving These Changes?
Several broader economic factors are at play:
Interest Rates
While inflation has moderated nationally, borrowing costs remain elevated compared to the ultra-low-rate period of 2020–2021. Even small interest rate shifts significantly impact affordability for buyers.
Alberta’s Economic Position
Alberta continues to outperform much of Canada economically, supported by energy sector stability and strong interprovincial migration. Many Canadians are relocating to Alberta for affordability and employment opportunities.
However:
-
Household debt remains high nationally.
-
Consumer confidence fluctuates.
-
Federal policy, inflation management, and global energy markets continue to influence local momentum.
Migration & Demographics
Alberta’s population growth supports housing demand long-term, including in bedroom communities like High River. But demand is normalizing after several exceptionally strong years.
What This Means for Buyers
-
More homes to choose from.
-
Less bidding-war pressure.
-
Greater negotiation room.
-
Strategic timing matters.
This is not a crash — it’s a rebalancing.
What This Means for Sellers
-
Pricing correctly matters more than ever.
-
Presentation and marketing are critical.
-
Expect longer timelines than 2022–2023 peaks.
-
Well-priced homes are still selling.
The Bottom Line
High River is transitioning from a fast-paced seller’s market to a more balanced environment. Compared to Okotoks and Calgary, activity remains steady, but inventory growth signals a healthier, more sustainable pace.
For 2026, expect:
✔ More negotiating power for buyers
✔ Stable but sensitive pricing
✔ Continued regional economic support from Alberta’s growth
YoY Market Statistic Trends - High River
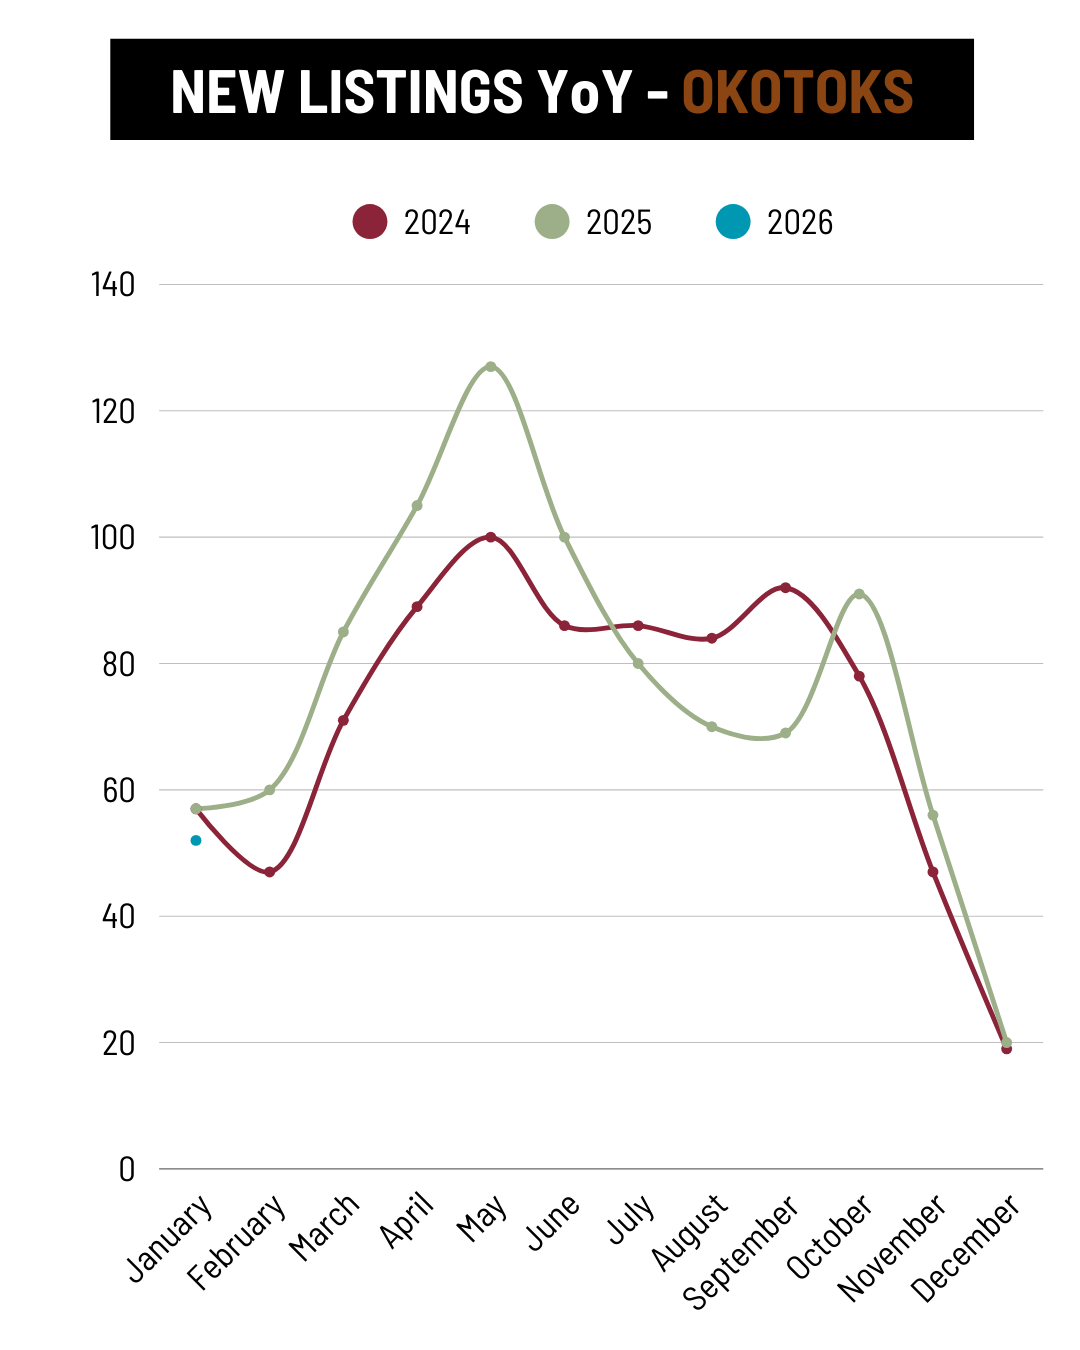
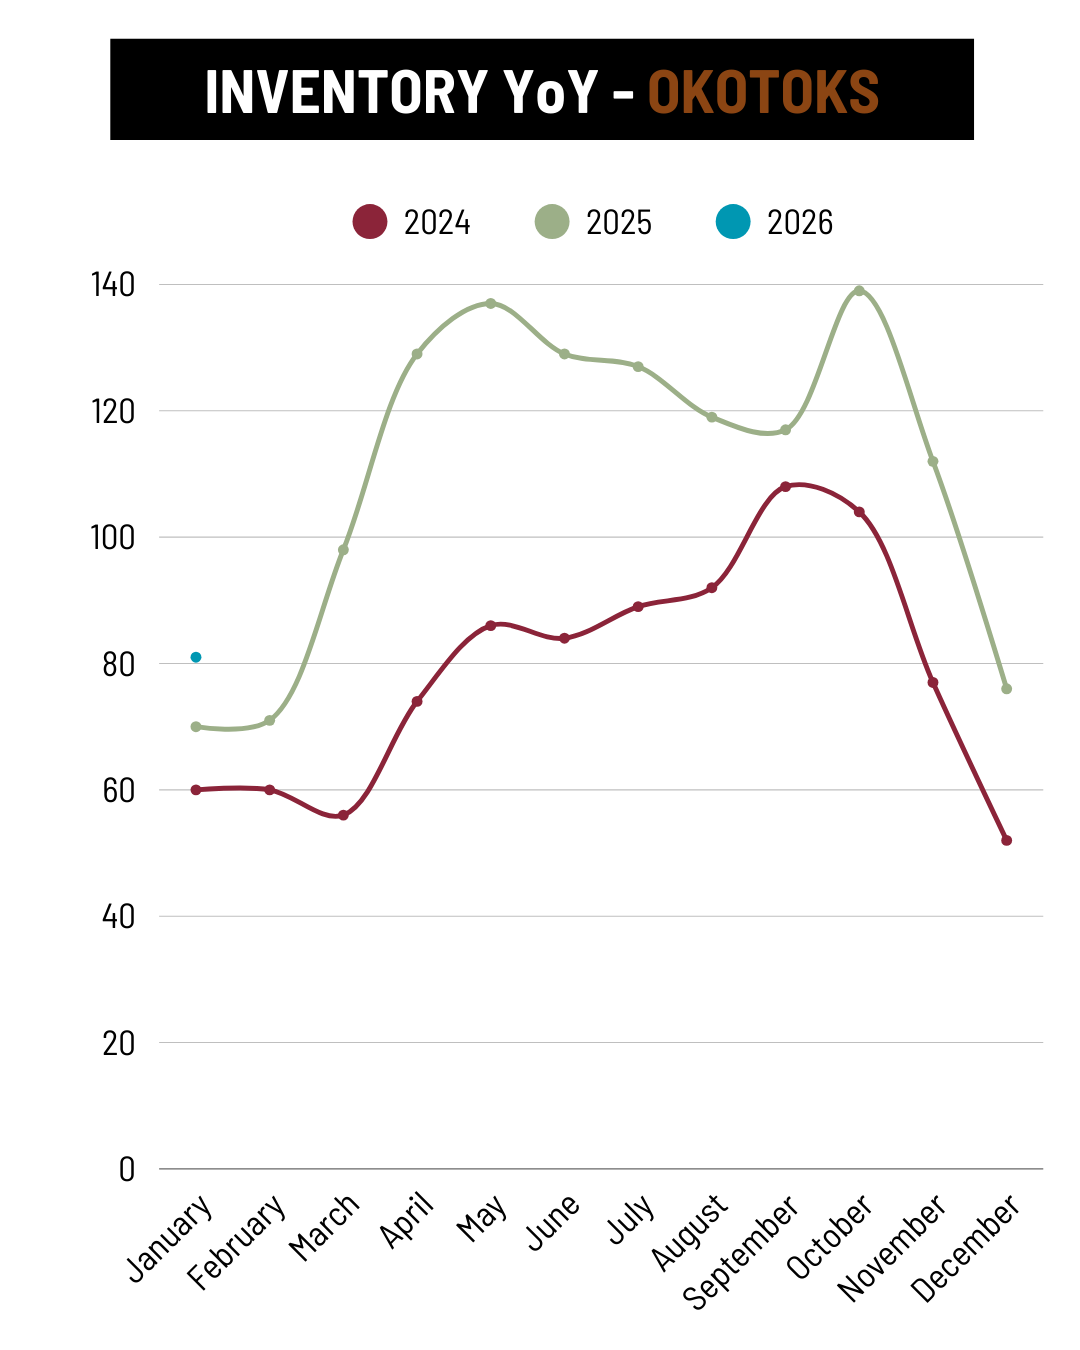
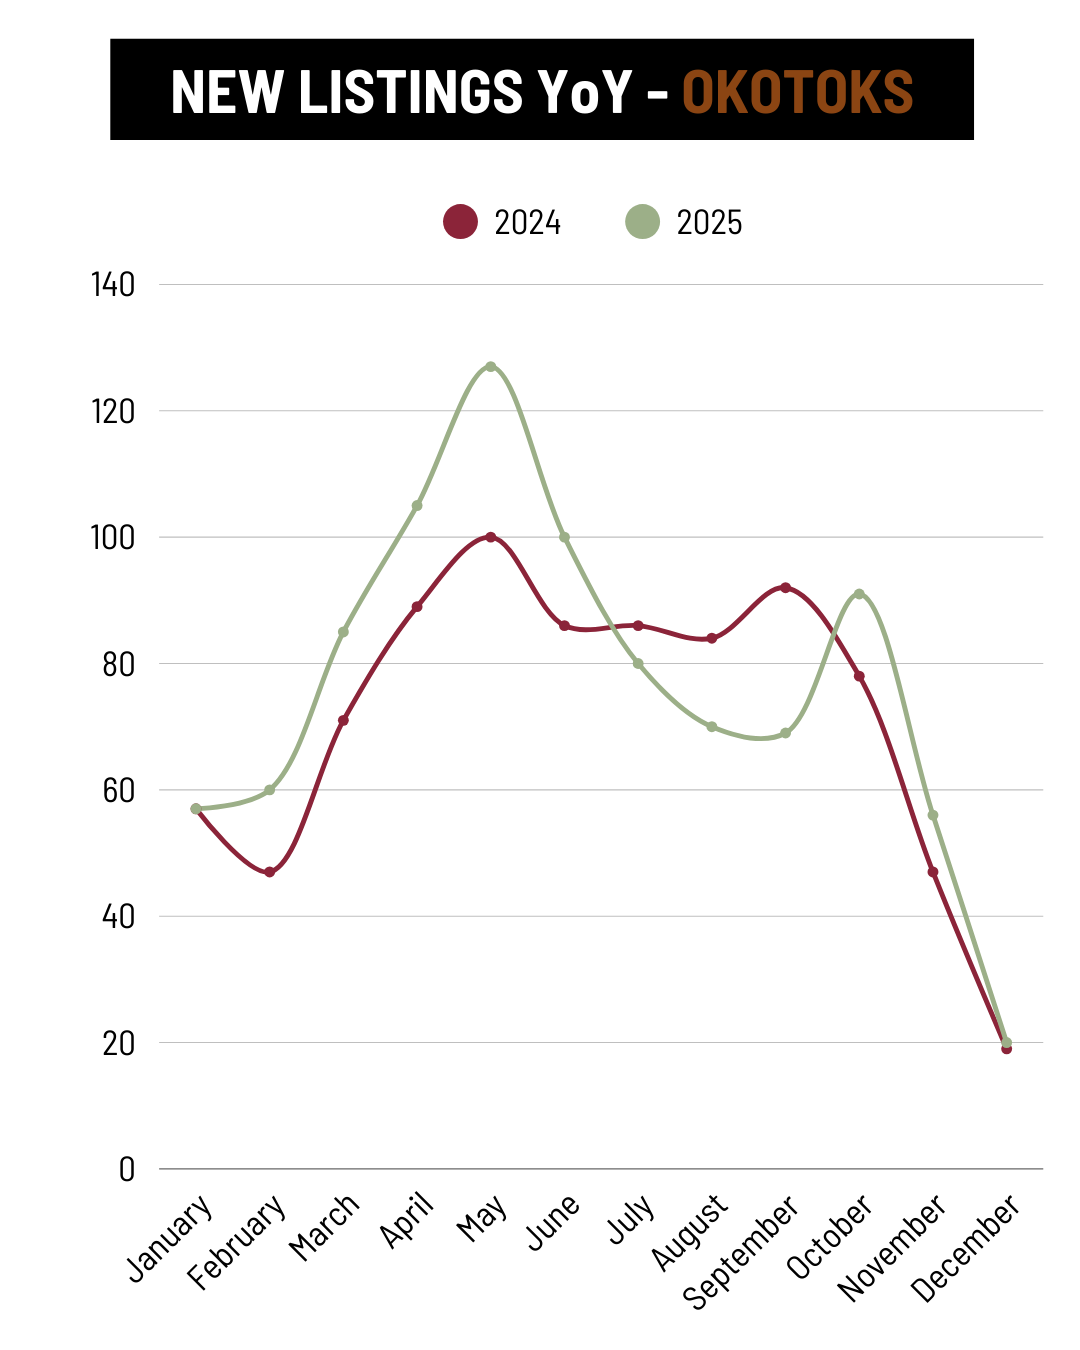
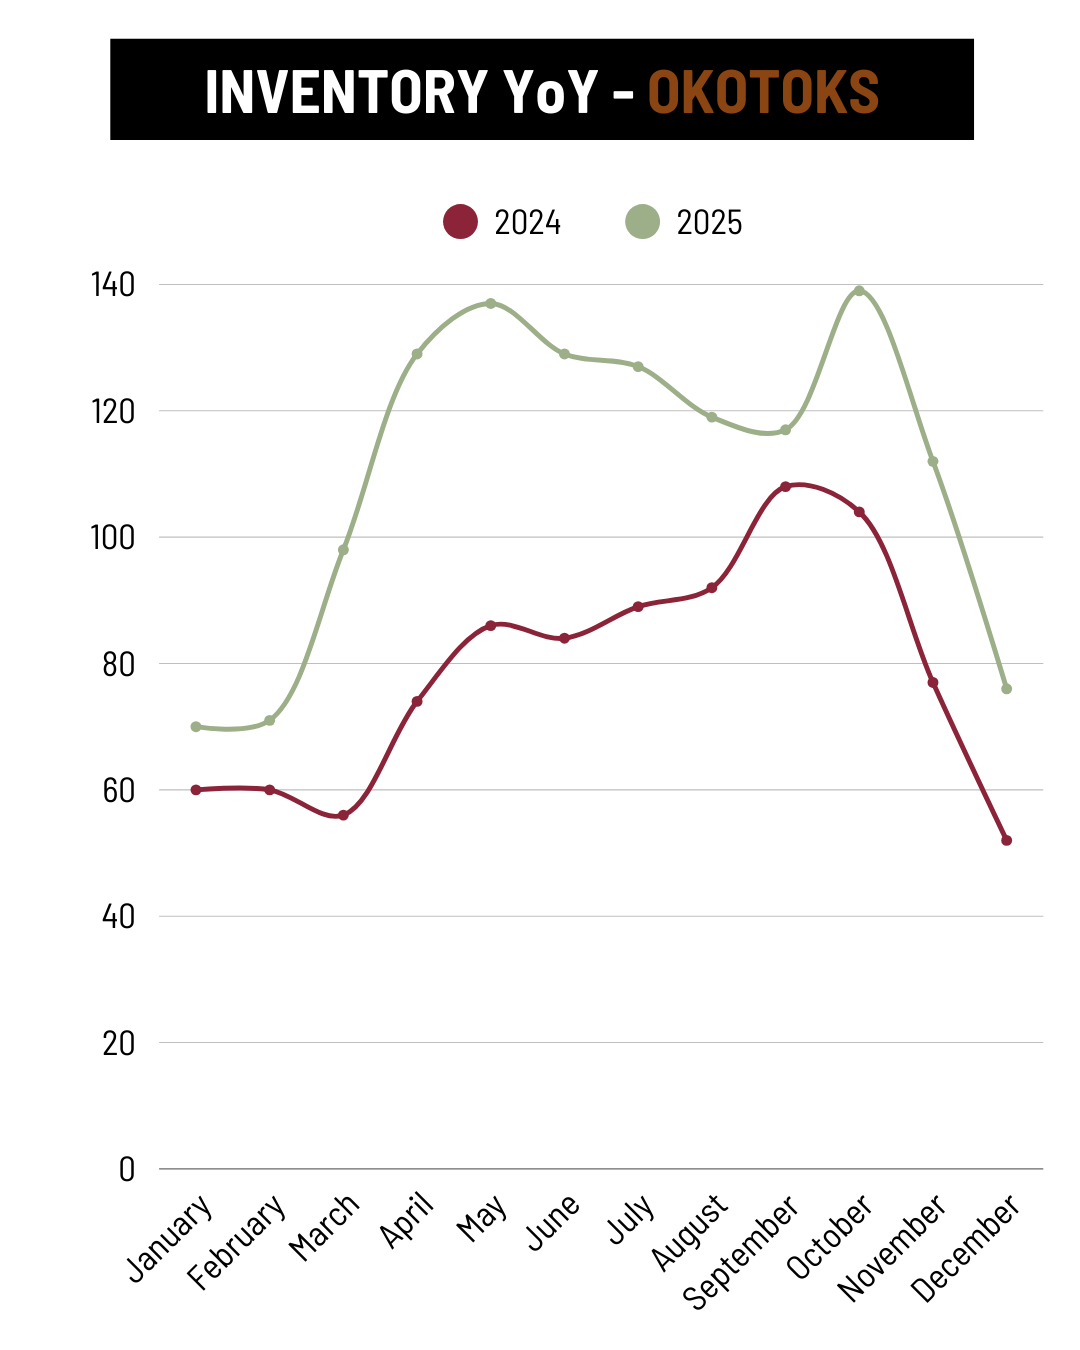
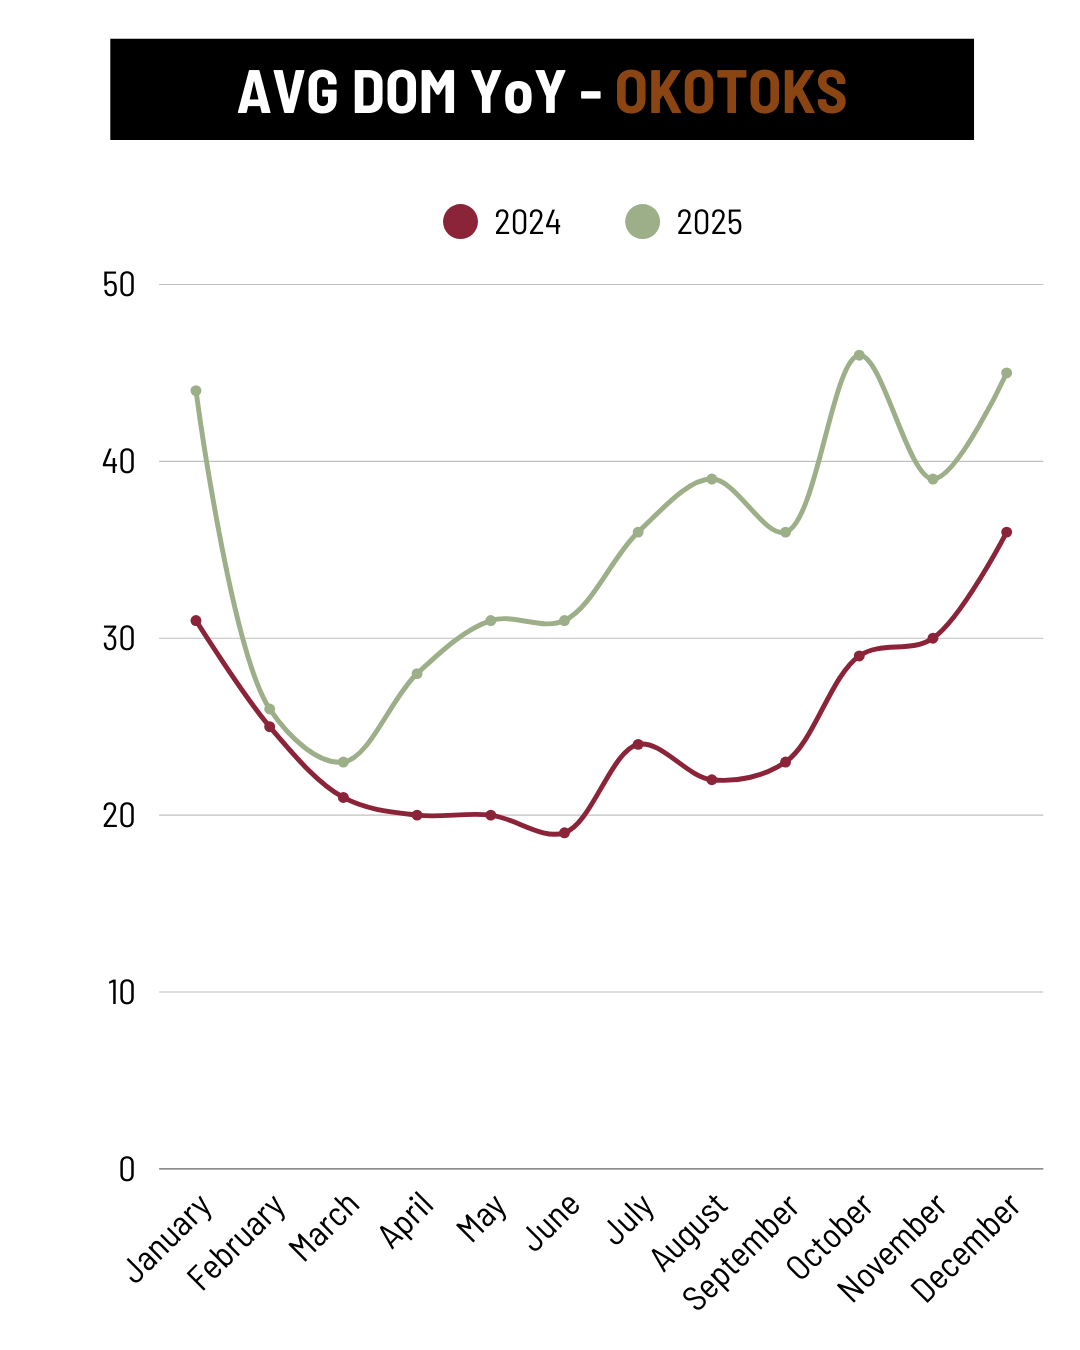
YoY Market Statistic Trends - Okotoks
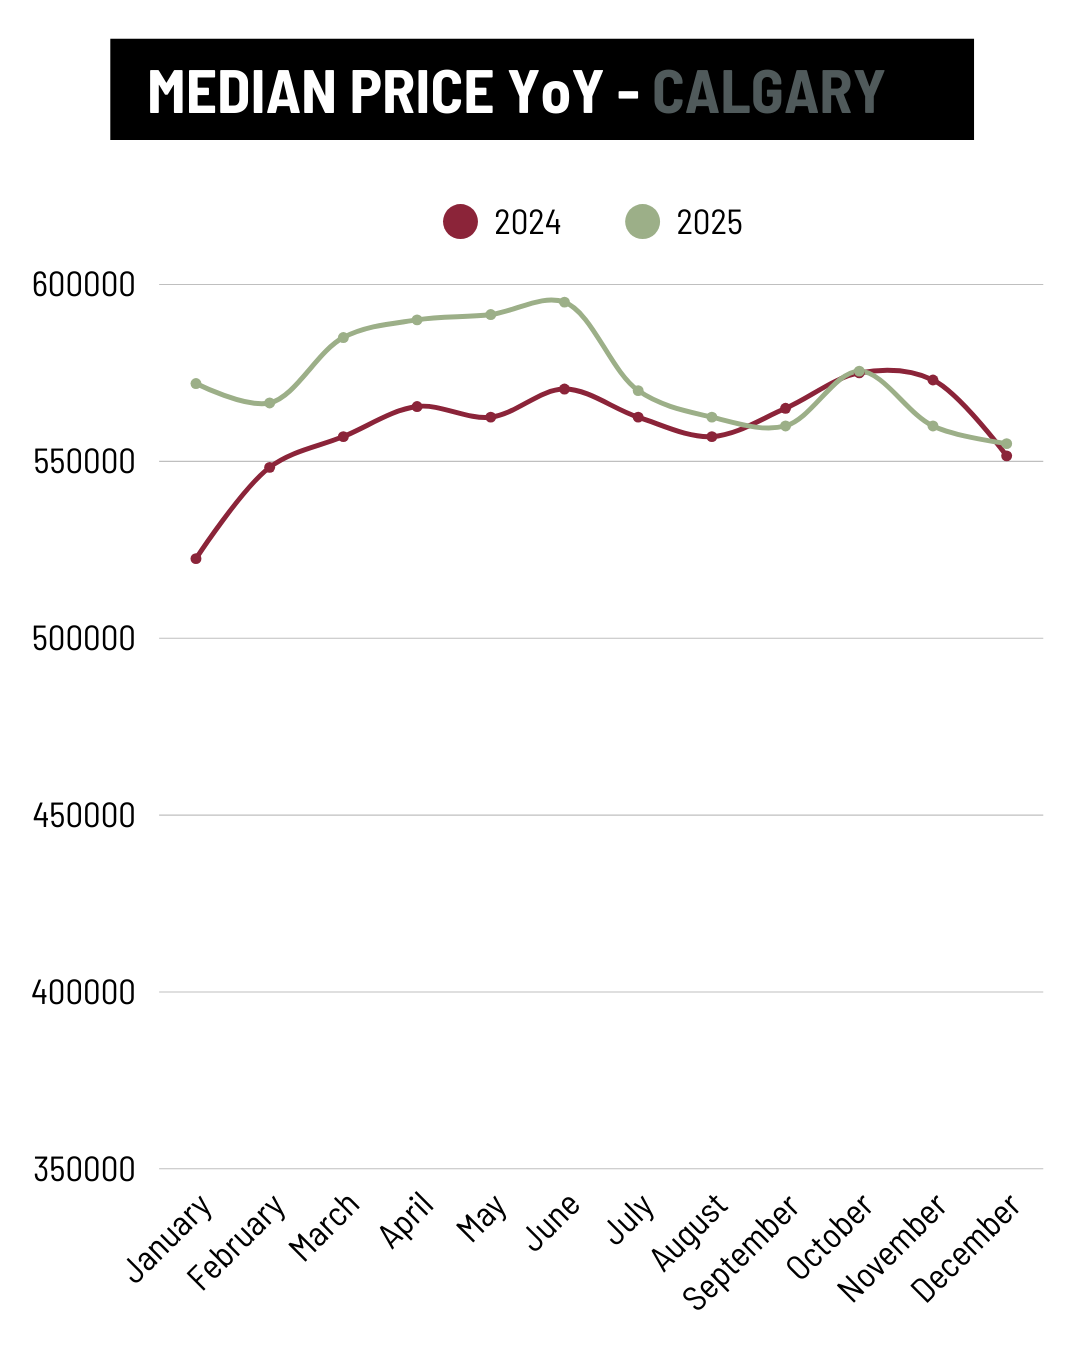
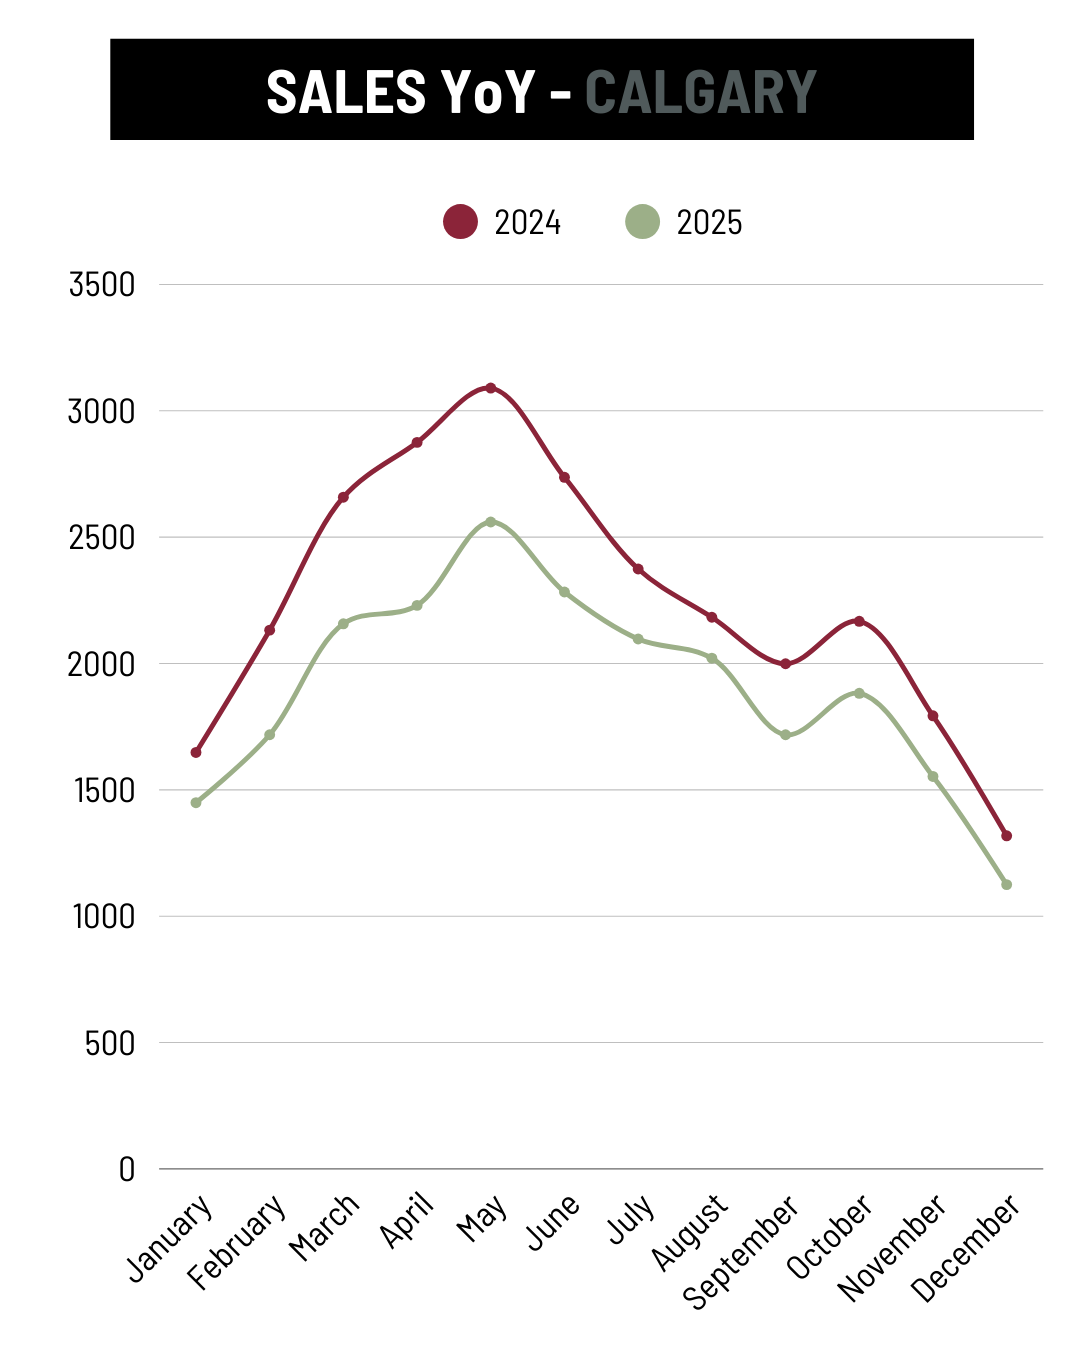
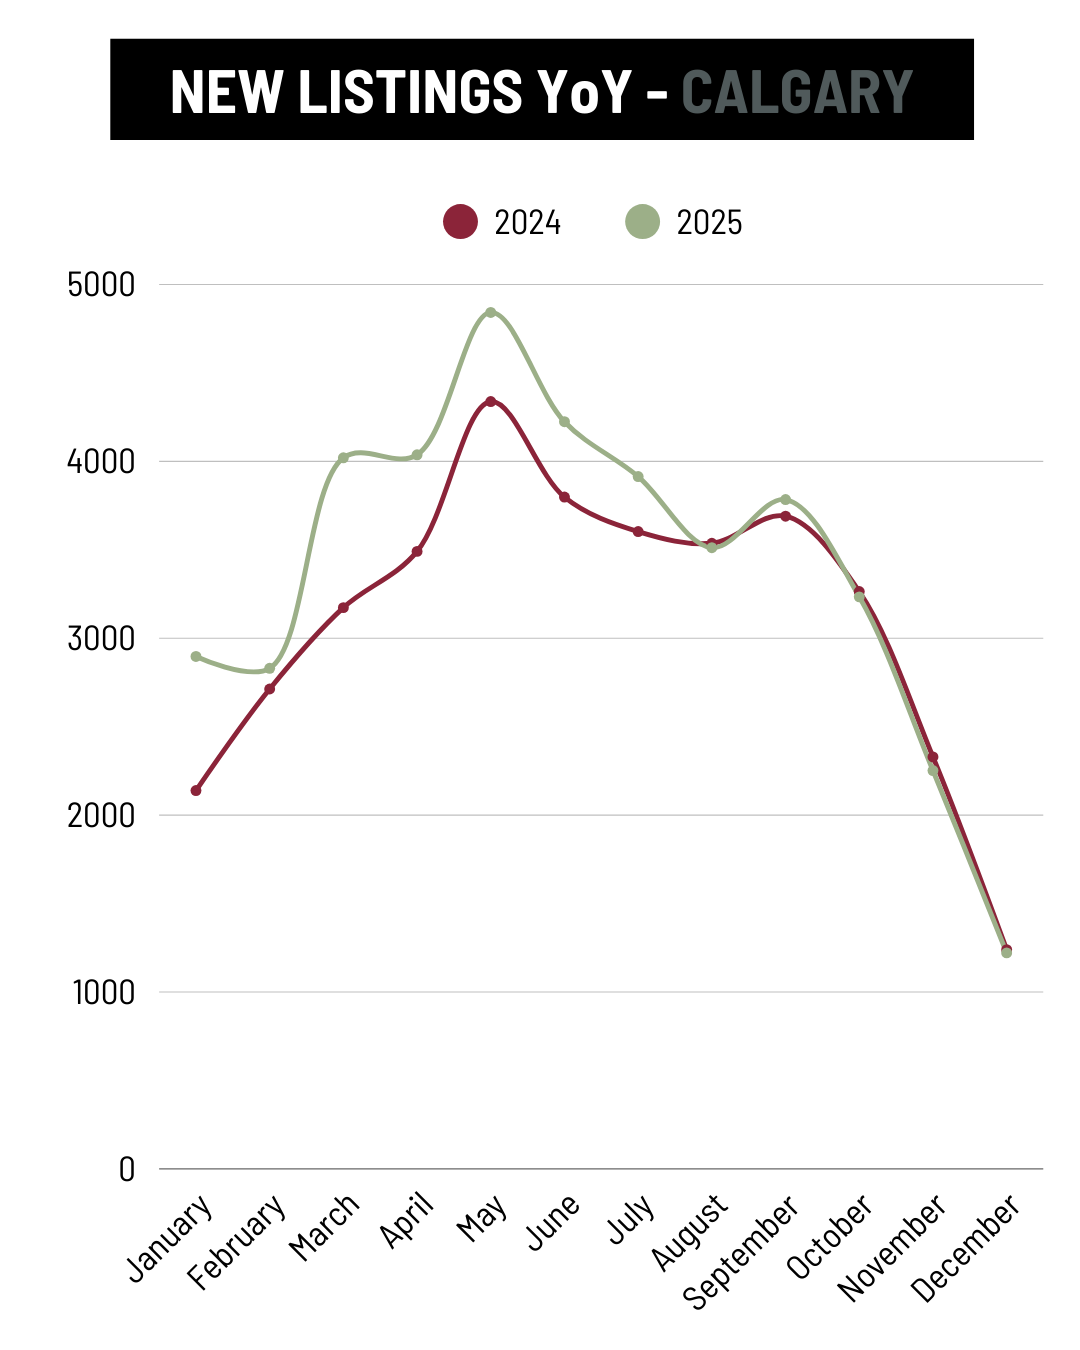
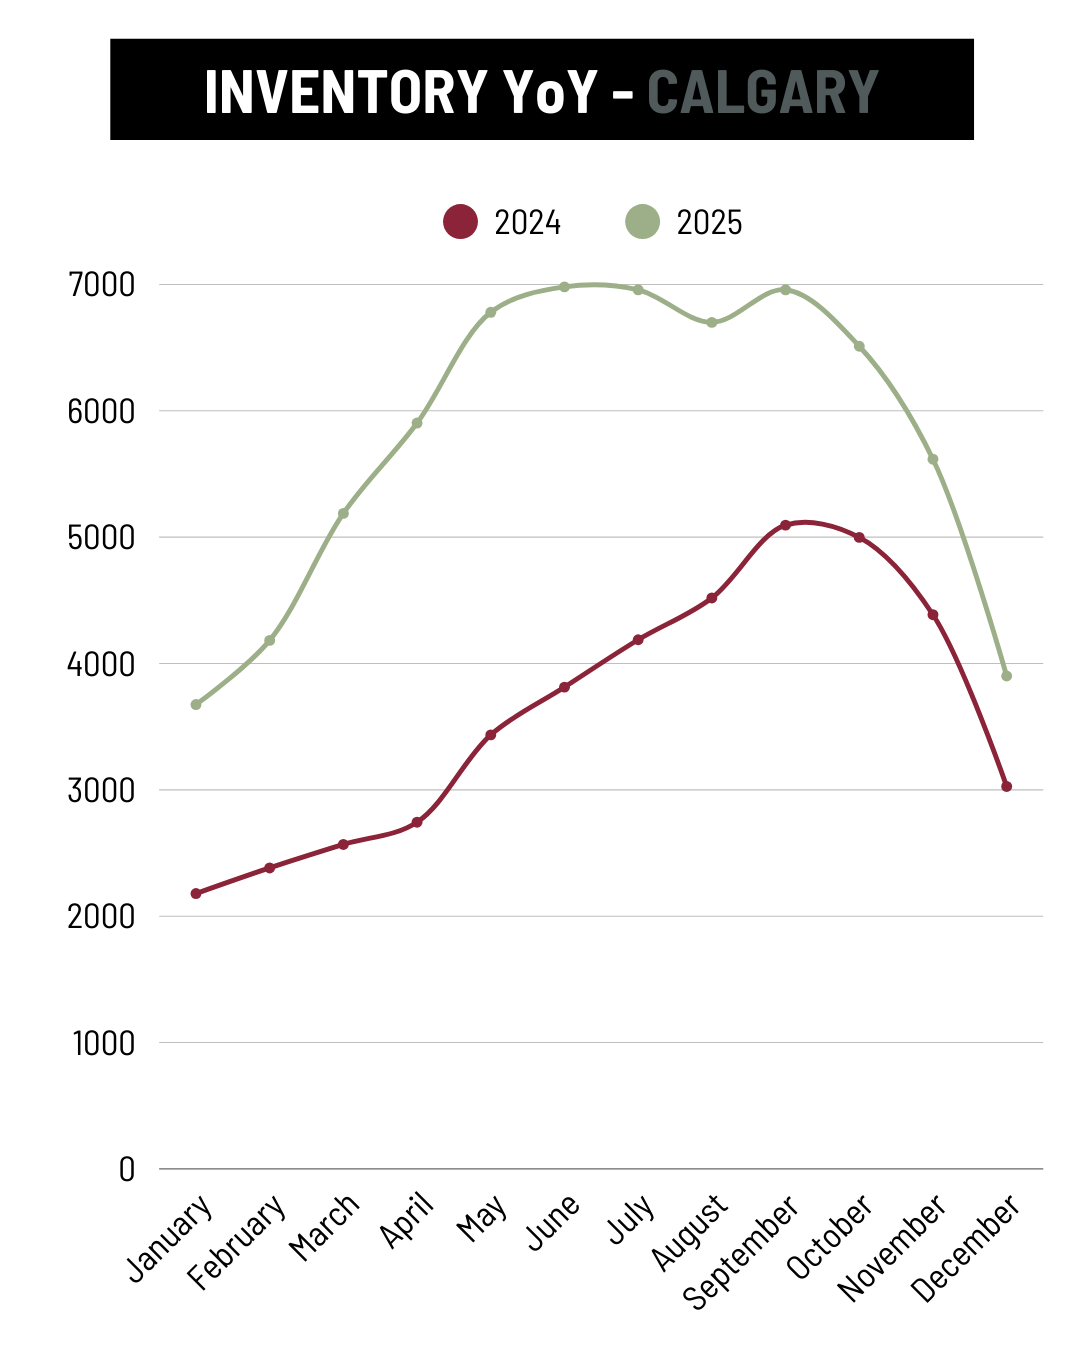
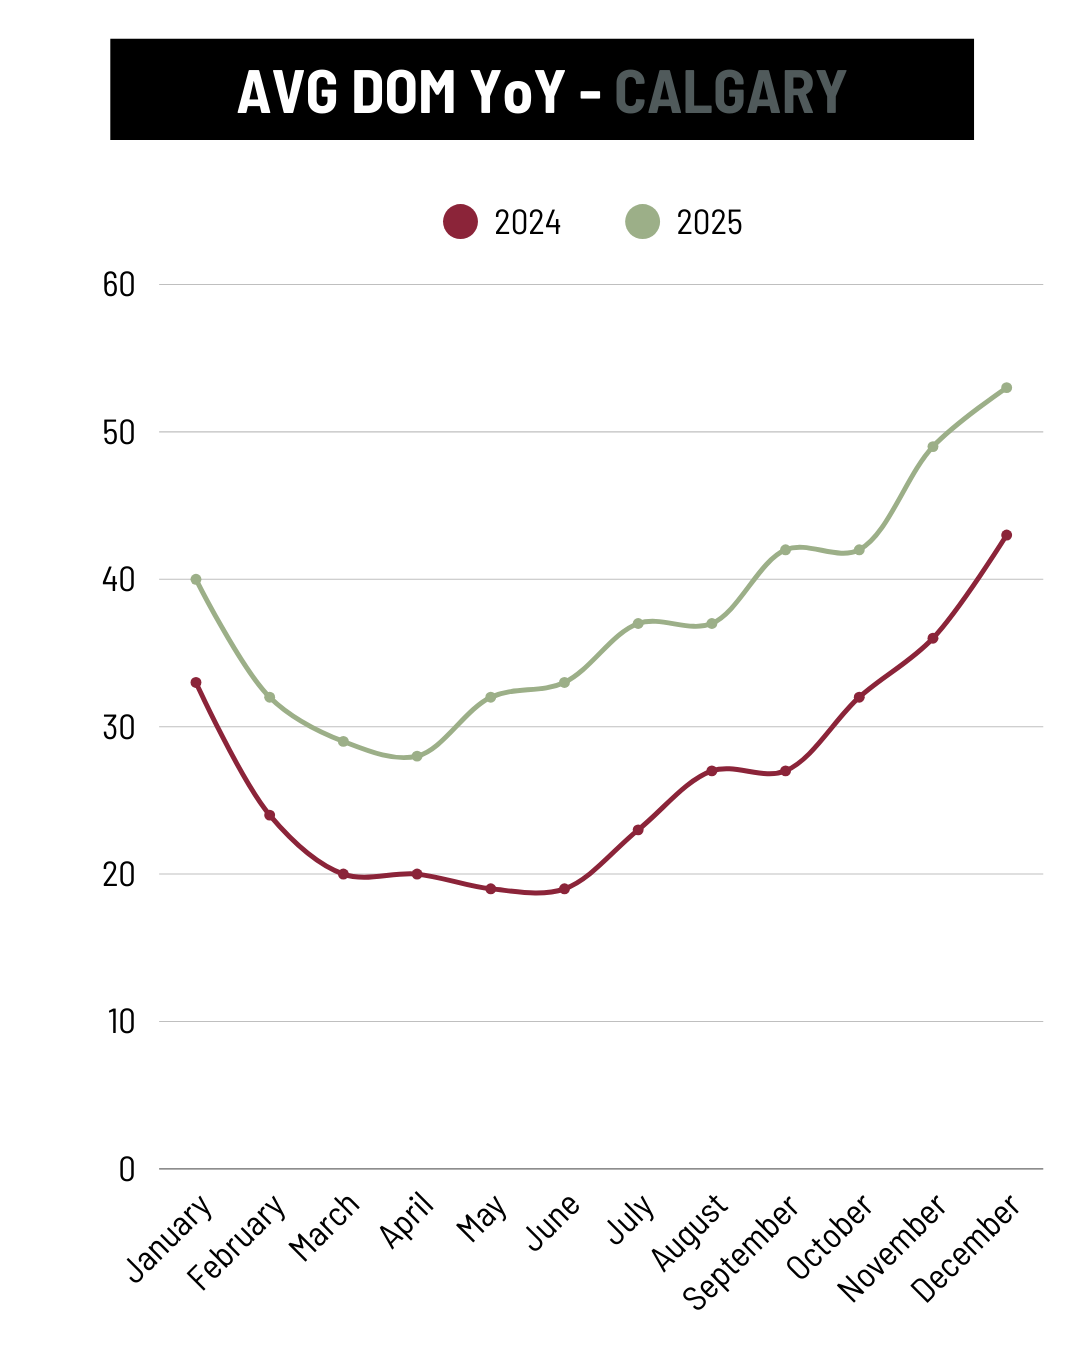
YoY Market Statistic Trends - Calgary
Why choose Seacrist Real Estate?
With over 40 years of combined experience and 1,300+ homes bought & sold for local families, we deliver strategic property solutions across High River, Cayley, Okotoks, Nanton, Diamond Valley, DeWinton, and area. As your Century 21 Foothills real estate advisors, we transform market complexity into clear, actionable insights so you can make the best real estate decisions.
Ready to make your strategic move?
Start with a complimentary consultation.
Market analysis for your specific property goals
Strategic timing guidance for optimal outcomes
Negotiation strategy session tailored to your situation
Investment potential assessment with trend forecasting
Why work with us?
🎯 Strategic negotiation expertise
📊 Data-driven local market intelligence
🏘️ Deep local market mastery
🤝 Professional partnership advantage
🌐 Century 21 global resources
⭐ 5 star reviews and 750+ satisfied local clients
Contact us today to get started.
Best Neighbourhoods in High River (2026) | Compare Areas, Prices & Property Taxes
By John Seacrist
Realtor, Seacrist Real Estate | C21 Foothills
February 13, 2026
Housing types, walkability, character, school proximity, parks, groceries, typical costs and more —organized by neighbourhood.
If you’re trying to choose where in High River you’d like to live (not just which house), this guide lays out the key differences neighbourhood-by-neighbourhood—using our Town’s subdivision boundaries as the baseline.
About pricing + taxes in this guide
Price positioning: Based on neighbourhood-level market snapshots from Zolo (these can swing if a neighbourhood has low sales volume—so treat them as a directional “range,” not an appraisal).
Property tax estimates: Derived from the Town of High River 2025 residential tax rates. 2026 rates may differ, but this gives a grounded estimate.
For a hyper-local price trend breakdown (what’s rising/softening, average days on market, buyer competition, etc.), contact us and we’ll run a neighbourhood-specific analysis for your short list.
Neighbourhoods | Quick Comparison
| Montrose | Newer detached + some duplex | Medium | Newer family homes | 2006–2026 | Planned feel; ponds + pathways | $515k–$700k | $3,925–$5,335 |
| Hampton Hills | Mostly detached | Medium | “Settled” family streets | 2001–2026 | Quiet, practical, consistent resale | $490k–$665k | $3,735–$5,070 |
| Emerson Lake Estates | Detached; some premium lots | High (recreation) | Lake/path lifestyle | 1970–1999 | Mature trees; “daily lake walk” vibe | $500k–$890k | $3,810–$6,785 |
| McLaughlin Meadows | Larger detached | Medium | Space + quiet | 1977–2005 | Calm, residential, bigger-home pocket | $540k–$730k | $4,115–$5,565 |
| Sunshine Meadows | Detached + condos/townhomes | Medium | Value + variety | 1988–2010 | Practical, mixed housing | $455k–$620k | $3,470–$4,725 |
| Northwest High River (North Central) | Established detached | Med–High (pocket-dependent) | Value near core services | 1960–1985 | Close-to-everything without being downtown | $255k–$380k | $1,945–$2,900 |
| Lineham Acres & Golf Course (incl. Polo Park) | Detached + villa/bungalow styles near golf | Medium | Mature lots, quiet NW, downsizers | 1990–2006 | Pride of ownership; lifestyle-driven | $445k–$670k | $3,390–$5,105 |
| Downtown High River | Character homes + older bungalows + apartments | High | Walk-to-life | 1900–1975 | Historic hub; easiest errands/events | $255k–$385k | $1,945–$2,935 |
| Central High River | Mixed detached/attached + some infill | Med–High | All-around convenience | 1950–2005 | “Heart-of-town” balance | $410k–$555k | $3,125–$4,230 |
| Highwood Village | Detached | Medium | Established NW family pick | 2000–2006 | Calm NW feel | $395k–$530k | $3,010–$4,040 |
| Vista Mirage | Detached | Medium | Quiet NW pocket | 1990–2006 | Smaller enclave feel | $460k–$690k | $3,505–$5,260 |
| Eagleview Estates | Detached (often value-oriented) | Medium | Budget-conscious NW | 1970–1995 | Value-driven pocket | $240k–$360k | $1,830–$2,745 |
| Sunrise Meadows | Detached + townhomes | Medium | First-time buyers, downsizers | 2007–2015 | Entry-friendly pricing | $225k–$340k | $1,715–$2,590 |
| Monteith | Newer detached + townhomes | Medium | Newer layouts | 2014–2025 | Modern streetscape | $380k–$510k | $2,895–$3,885 |
| Redtail Rise | Premium detached | Low–Med | Premium newer builds | 2020–2026 | Low-density, upscale | $1.0M–$1.5M | $7,620–$11,430 |
*Tax estimate = price × 0.76203% (using Town 2025 residential mill rate).
Neighbourhoods | More Details
🏘️ MONTROSE (CENTRAL SOUTH)
- Housing types: Newer detached homes, some duplexes
- Walkability: Medium—great internal pathways/ponds, but errands are usually a drive
- Best for: Families who want newer builds and a planned-community feel
- Home ages: Mostly 2006–2026 (many 2010s–2020s builds, and newer construction in recent years)
- Schools & amenities (typical):
- Spitzee or Joe Clark School: ~6–12 min drive / ~25–55 min walk
- Bob Snodgrass Recreation Complex: ~5–10 min drive
- Calgary Co-op (Montrose): ~3–8 min drive
- Neighbourhood pathways/ponds: 5–10 min walk
- Neighbourhood characteristics: Pond system + pathways; strong family presence
- Approx. 2026 Price Range: $515,000–$700,000
- Estimated Property Taxes: ~$3,925–$5,335 annually
🏘️ HAMPTON HILLS (NORTH EAST)
- Housing types: Mostly detached homes; practical family layouts
- Walkability: Medium
- Best for: Established but not aging family neighbourhood
- Home ages: Largely 2001–2015 (and newer construction in recent years)
- Schools & amenities (typical):
- Joe Clark School: ~5–10 min drive / ~25–50 min walk
- Bob Snodgrass Recreation Complex: ~6–12 min drive
- Sobeys / No Frills: ~6–12 min drive
- Local parks: 5–15 min walk
- Neighbourhood characteristics: Quiet streets, strong resale consistency
- Approx. 2026 Price Range: $490,000–$665,000
- Estimated Property Taxes: ~$3,735–$5,070 annually
🏘️ EMERSON LAKE ESTATES (SOUTH EAST)
- Housing types: Detached homes, some lake-adjacent
- Walkability: High for recreation (lake pathways)
- Best for: Buyers prioritizing daily outdoor lifestyle
- Home ages: Mostly 1970–1999, with many updated interiors
- Schools & amenities (typical):
- Spitzee / Senator Riley: ~3–8 min drive / ~15–40 min walk
- Bob Snodgrass Recreation Complex: ~5–10 min drive
- Sobeys: ~4–10 min drive
- Emerson Lake pathway loop: 5–10 min walk
- Neighbourhood characteristics: Mature trees + lake lifestyle
- Approx. 2026 Price Range: $500,000–$890,000
- Estimated Property Taxes: ~$3,810–$6,785 annually
🏘️ MCLAUGHLIN MEADOWS (SOUTH WEST)
- Housing types: Larger detached homes
- Walkability: Medium
- Best for: Families wanting space and quieter streets
- Home ages: Commonly 1977–2005
- Schools & amenities (typical):
- Joe Clark: ~4–9 min drive
- Bob Snodgrass Recreation Complex: ~4–9 min drive
- Sobeys / No Frills: ~5–10 min drive
- Neighbourhood characteristics: Calm, residential feel
- Approx. 2026 Price Range: $540,000–$730,000
- Estimated Property Taxes: ~$4,115–$5,565 annually
🏘️ SUNSHINE MEADOWS (SOUTH EAST)
- Housing types: Detached homes plus condo/townhome options
- Walkability: Medium
- Best for: Value + variety
- Home ages: Mostly 1988–2010
- Schools & amenities (typical):
- Joe Clark: ~3–8 min drive
- Bob Snodgrass Recreation Complex: ~4–9 min drive
- Sobeys: ~5–10 min drive
- Sunshine Lake / nearby parks: 5–15 min walk
- Neighbourhood characteristics: Practical family area
- Approx. 2026 Price Range: $455,000–$620,000
- Estimated Property Taxes: ~$3,470–$4,725 annually
🏘️ NORTH CENTRAL (CENTRAL)
- Housing types: Established detached homes
- Walkability: Medium to high depending on pocket
- Best for: Buyers seeking affordability + proximity to core services
- Home ages: Often 1960–1985
- Schools & amenities (typical):
- Spitzee School: ~3–7 min drive
- George Lane Memorial Park: ~4–10 min drive
- Sobeys: ~5–10 min drive
- Neighbourhood characteristics: Close-to-everything feel without being downtown
- Approx. 2026 Price Range: $255,000–$380,000
- Estimated Property Taxes: ~$1,945–$2,900 annually
🏘️ LINEHAM ACRES & GOLF COURSE (NORTH WEST) — includes Polo Park
- Housing types: Detached homes, some golf-adjacent properties, bungalow/villa styles
- Walkability: Medium (excellent for golf-course walks)
- Best for: Mature lots and quieter NW lifestyle
- Home ages: Mostly 1990–2006
- Schools & amenities (typical):
- Schools: ~5–10 min drive
- Bob Snodgrass Recreation Complex: ~6–12 min drive
- Golf course access: 5–10 min walk
- Neighbourhood characteristics: Pride of ownership, lifestyle-driven
- Approx. 2026 Price Range: $445,000–$670,000
- Estimated Property Taxes: ~$3,390–$5,105 annually
Polo Park Note: Polo Park is located within the NW golf course/Lineham Acres area and is known locally for adult-lifestyle bungalow living.
🏘️ DOWNTOWN HIGH RIVER & OLD RODEO GROUNDS (CENTRAL)
- Housing types: Character homes, older bungalows, apartments
- Walkability: High (most walkable in town)
- Best for: Buyers wanting main-street energy
- Home ages: Often 1900–1975 (renovation-dependent)
- Schools & amenities (typical):
- Spitzee School: ~2–7 min drive / ~10–30 min walk
- George Lane Park: 5–10 min walk
- Sobeys: ~3–8 min drive
- Neighbourhood characteristics: Historic, community hub
- Approx. 2026 Price Range: $255,000–$385,000
- Estimated Property Taxes: ~$1,945–$2,935 annually
🏘️ CENTRAL HIGH RIVER & SOUTHWEST & SOUTHEAST CENTRAL (CENTRAL)
- Housing types: Mixed detached + attached + infill
- Walkability: Medium to high
- Best for: Balanced convenience
- Home ages: Commonly 1950–2005
- Schools & amenities (typical):
- Schools: ~2–7 min drive
- Bob Snodgrass Recreation Complex: ~3–8 min drive
- Sobeys: ~3–9 min drive
- Neighbourhood characteristics: Practical, central location
- Approx. 2026 Price Range: $410,000–$555,000
- Estimated Property Taxes: ~$3,125–$4,230 annually
🏘️ HIGHWOOD VILLAGE (NORTH WEST)
- Housing types: Detached homes
- Walkability: Medium
- Best for: Established NW family neighbourhood
- Home ages: Mostly 2000–2006
- Schools & amenities (typical):
- Schools: ~5–10 min drive
- Groceries: ~6–12 min drive
- Neighbourhood characteristics: Calm NW feel
- Approx. 2026 Price Range: $395,000–$530,000
- Estimated Property Taxes: ~$3,010–$4,040 annually
🏘️ VISTA MIRAGE (NORTH WEST)
- Housing types: Detached homes
- Walkability: Medium
- Best for: Quiet NW pocket
- Home ages: Typically 1990–2006
- Schools & amenities (typical):
- Schools: ~5–10 min drive
- Golf course: ~5–10 min drive
- Neighbourhood characteristics: Smaller enclave feel
- Approx. 2026 Price Range: $460,000–$690,000
- Estimated Property Taxes: ~$3,505–$5,260 annually
🏘️ EAGLEVIEW ESTATES (NORTH WEST)
- Housing types: Detached homes
- Walkability: Medium
- Best for: Budget-conscious NW buyers
- Home ages: Commonly 1970–1995
- Schools & amenities (typical):
- Schools: ~5–10 min drive
- Groceries: ~7–12 min drive
- Neighbourhood characteristics: Quiet, value-oriented
- Approx. 2026 Price Range: $240,000–$360,000
- Estimated Property Taxes: ~$1,830–$2,745 annually
🏘️ SUNRISE MEADOWS (SOUTH EAST)
- Housing types: Detached + townhomes
- Walkability: Medium
- Best for: First-time buyers
- Home ages: Mostly 2007–2015
- Schools & amenities (typical):
- Schools: ~4–9 min drive
- Rec Complex: ~6–12 min drive
- Neighbourhood characteristics: Affordable entry area
- Approx. 2026 Price Range: $225,000–$340,000
- Estimated Property Taxes: ~$1,715–$2,590 annually
🏘️ MONTEITH (SOUTH WEST)
- Housing types: Newer detached + townhomes
- Walkability: Medium
- Best for: Buyers seeking 2010s+ builds
- Home ages: Typically 2014–2025
- Schools & amenities (typical):
- Schools: ~5–10 min drive
- Rec Complex: ~5–10 min drive
- Groceries: ~4–9 min drive
- Neighbourhood characteristics: Modern streetscape
- Approx. 2026 Price Range: $380,000–$510,000
- Estimated Property Taxes: ~$2,895–$3,885 annually
🏘️ REDTAIL RISE (SOUTH EAST)
- Housing types: Premium detached homes
- Walkability: Low to medium
- Best for: Luxury buyers
- Home ages: Mostly 2020–2026
- Schools & amenities (typical):
- Schools: ~7–12 min drive
- Groceries: ~7–13 min drive
- Neighbourhood characteristics: New, low-density, upscale
- Approx. 2026 Price Range: $1,000,000–$1,500,000
- Estimated Property Taxes: ~$7,620–$11,430 annually
❓ Frequently Asked Questions About High River Neighbourhoods
Why choose Seacrist Real Estate?
With over 40 years of combined experience and 1,300+ homes bought & sold for local families, we deliver strategic property solutions across High River, Cayley, Okotoks, Nanton, Diamond Valley, DeWinton, and area. As your Century 21 Foothills real estate advisors, we transform market complexity into clear, actionable insights so you can make the best real estate decisions.
Ready to make your strategic move?
Start with a complimentary consultation.
Market analysis for your specific property goals
Strategic timing guidance for optimal outcomes
Negotiation strategy session tailored to your situation
Investment potential assessment with trend forecasting
Why work with us?
🎯 Strategic negotiation expertise
📊 Data-driven local market intelligence
🏘️ Deep local market mastery
🤝 Professional partnership advantage
🌐 Century 21 global resources
⭐ 5 star reviews and 750+ satisfied local clients
Contact us today to get started.
High River Real Estate Market 2025: Annual Trends & 2026 Outlook
By John Seacrist
Realtor, Seacrist Real Estate | C21 Foothills
January 20, 2026
High River Real Estate Market: 2025 Year in Review
The High River real estate market in 2025 marked a decisive shift away from the ultra-competitive conditions of recent years and into a more measured, balanced environment. While home prices continued to rise, nearly every other key metric signaled a market recalibrating under affordability pressures, higher supply, and changing buyer behavior.

Prices: Still Rising, Despite Cooling Conditions
Despite a clear slowdown in activity, High River’s median home price increased 6% year-over-year in 2025. This reflects continued demand, limited large-scale new construction, and the ongoing desirability of smaller Alberta communities offering relative affordability compared to larger urban centres.
However, price growth occurred alongside longer selling timelines and increased inventory, indicating that gains were driven more by underlying fundamentals than by bidding wars or urgency.
Sales & Supply: Demand Softened as Choice Increased
Total home sales declined by 14%, while new listings edged up 3%. The result was a 43% increase in inventory, fundamentally changing market dynamics.
This shift reduced the sales-to-new-listings ratio from 0.88 to 0.74, a strong signal that buyer leverage increased significantly in 2025. Buyers were no longer forced to act quickly, and conditional offers became more common.
From a broader perspective, this aligns with:
-
Elevated interest rates and mortgage stress tests
-
Greater caution among buyers amid economic uncertainty
-
Demographic stability rather than rapid population inflow
Market Pace: A Return to Normal Timelines
Average days on market increased 16%, from 31 days in 2024 to 36 days in 2025. While this represents a slower market, it remains well within historically healthy norms.
Instead of signaling weakness, longer timelines reflect:
-
Buyers performing more due diligence
-
Sellers adjusting pricing expectations
-
A reduction in panic-driven purchasing
What This Means for 2026
For Buyers
-
More inventory means more negotiating power
-
Reduced pressure to waive conditions
-
Pricing sensitivity will remain, especially if rates stay elevated
Strategy: Focus on value, condition, and long-term suitability rather than speed.
For Sellers
-
Pricing correctly from the outset is critical
-
Homes that are well-staged and well-maintained will stand out
-
Overpriced homes are likely to sit longer and face reductions
Strategy: Preparation and realistic expectations matter more than ever.
The Bottom Line
2025 represented a return to balance for High River real estate. Prices remained resilient, but the market became more deliberate, transparent, and sustainable.
If 2024 was a year of momentum, 2025 was a year of recalibration — and 2026 is shaping up to reward strategy on both sides of the transaction.
YoY Market Statistic Trends - High River
Why choose Seacrist Real Estate?
With over 40 years of combined experience and 1,300+ homes bought & sold for local families, we deliver strategic property solutions across High River, Cayley, Okotoks, Nanton, Diamond Valley, DeWinton, and area. As your Century 21 Foothills real estate advisors, we transform market complexity into clear, actionable insights so you can make the best real estate decisions.
Ready to make your strategic move?
Start with a complimentary consultation.
Market analysis for your specific property goals
Strategic timing guidance for optimal outcomes
Negotiation strategy session tailored to your situation
Investment potential assessment with trend forecasting
Why work with us?
🎯 Strategic negotiation expertise
📊 Data-driven local market intelligence
🏘️ Deep local market mastery
🤝 Professional partnership advantage
🌐 Century 21 global resources
⭐ 5 star reviews and 750+ satisfied local clients
Contact us today to get started.
Monthly Real Estate Market Update - December 2025 | High River, Okotoks, Calgary
By John Seacrist
Realtor, Seacrist Real Estate | C21 Foothills
January 14, 2026
As we close out 2025, High River’s real estate market is clearly transitioning into a more balanced and seasonal phase. Looking at both month-over-month and year-over-year data from November and December helps explain how local conditions compare to nearby Okotoks and Calgary — and how broader economic forces are shaping buyer and seller behaviour.
High River: Steady Prices, Seasonal Slowdown
In November, High River’s median home price climbed to $544,000, up 4% year-over-year, before easing slightly in December to $525,000, still 1% higher than last year. This small pullback is typical heading into winter and does not signal a sharp correction.
Sales activity remained stable year-over-year, with 20 sales in November and 12 in December, while new listings slowed toward year-end. Inventory, however, remained significantly higher than last year, giving buyers more choice than they’ve had in recent winters. Homes are taking longer to sell compared to the ultra-tight markets of previous years, but days on market actually improved compared to late 2024 — showing that well-priced homes are still moving.
How High River Compares
-
Okotoks experienced stronger price growth in December, with values up 12% year-over-year, but sales remained flat and days on market increased, indicating more supply and slower decision-making.
-
Calgary continued to see declining sales and rising inventory, with prices mostly flat. Buyer demand remains present, but less urgent, particularly as affordability pressures persist.
Against this backdrop, High River stands out for its relative stability — avoiding the sharper slowdowns seen in larger urban markets while still benefiting from regional demand.
Broader Economic Context
Alberta continues to outperform much of Canada economically, driven by population growth, employment opportunities, and comparatively affordable housing. However, national factors such as higher interest rates, cost-of-living pressures, and tighter mortgage qualification rules are influencing buyer behavior everywhere — including Southern Alberta.
Politically and economically, uncertainty around rates and long-term inflation has made buyers more cautious. Socially, buyers are prioritizing livability, affordability, and smaller communities — which continues to support demand in towns like High River. The result is not a slowdown, but a recalibration toward a more predictable and sustainable market.
What This Means Going Into 2026
High River is entering the new year with:
-
Stable prices
-
More balanced inventory
-
Less competition, but steady demand
-
More thoughtful buyers and sellers
What This Means for Buyers & Sellers
For buyers, this means more choice and improved negotiating conditions. For sellers, success will depend more on pricing, presentation, and strategy than on sheer market momentum.
Final Thoughts
Keep in mind that monthly market updates capture only a moment in time. For the clearest picture of your neighbourhood or property’s value, it’s important to consider broader trends, seasonal patterns, and your personal real estate goals.
If you’d like an updated market evaluation or help understanding these numbers, our team is here to help.
YoY Market Statistic Trends - High River
YoY Market Statistic Trends - Okotoks

YoY Market Statistic Trends - Calgary
Why choose Seacrist Real Estate?
With over 40 years of combined experience and 1,300+ homes bought & sold for local families, we deliver strategic property solutions across High River, Cayley, Okotoks, Nanton, Diamond Valley, DeWinton, and area. As your Century 21 Foothills real estate advisors, we transform market complexity into clear, actionable insights so you can make the best real estate decisions.
Ready to make your strategic move?
Start with a complimentary consultation.
Market analysis for your specific property goals
Strategic timing guidance for optimal outcomes
Negotiation strategy session tailored to your situation
Investment potential assessment with trend forecasting
Why work with us?
🎯 Strategic negotiation expertise
📊 Data-driven local market intelligence
🏘️ Deep local market mastery
🤝 Professional partnership advantage
🌐 Century 21 global resources
⭐ 5 star reviews and 750+ satisfied local clients
Contact us today to get started.
CONTACT US
JOHN & TRISH SEACRIST
618 Centre Street SE, High River, AB T1V1E9
(403) 603-8260
GET SOCIAL

Independently Owned and Operated. ®/™ trademarks owned by Century 21 Real Estate LLC used under license or authorized sub-license. © 2020 Century 21 Canada Limited Partnership © 2020 Century 21 Canada Limited Partnership
The trademarks MLS®, Multiple Listing Service® and the associated logos identify professional services rendered by REALTOR® members of CREA to effect the purchase, sale and lease of real estate as part of a cooperative selling system. The trademarks REALTOR ® , REALTORS ® and the REALTOR ® logo are controlled by The Canadian Real Estate Association (CREA) and identify real estate professionals who are members of CREA. Used under license. This listing content provided by REALTOR.ca has been licensed by REALTOR® members of The Canadian Real Estate Association. Not intended to solicit properties currently listed for sale or buyers under contract.
Century 21 Canada Limited Partnership currently has franchise opportunities available in select markets across Canada. The intent of this communication is for informational purposes only and is not intended to be a solicitation to anyone under contract with another real estate brokerage operation. This e-mail message contains confidential information intended only for the use of the individual or entity named above. Any unauthorized use or disclosure is strictly prohibited. If you have received this communication in error please immediately delete the e-mail and either notify the sender at the above e-mail address or by telephone.
© 2023 MoxiWorks
